Using the Sentry Unity SDK for Error and Crash Reporting


Erin T -

It’s one thing to debug your game during development, but once your game is in production, visibility into errors and failures in real gameplay is harder to achieve. And when something does go wrong, players are more likely to ragequit than submit a bug ticket.
In this post, we’ll walk through a tutorial showcasing how Sentry uncovers real issues – from runtime exceptions to misconfigured prefab references – in real gameplay for Unity developers, and give you the right context (like screenshots or line numbers for a NullReferenceException) to fix them faster.
Our demo game, Sentaur Survivors, is a fully functional, Sentry-themed game built during a company hack week by our engineering team. It breaks a lot and is full of schnitzel.
Before we dig into the tutorial, let’s cover how Sentry can help Unity devs:
The Sentry Unity SDK provides production-ready Unity crash reporting and error monitoring for real gameplay across desktop, mobile, web, and console platforms. It goes beyond standard logging by making the complete context visible surrounding a Unity crash or error, including:
Human-readable stack traces for crashes and exceptions
Player actions and engine events leading up to an error
Optional automatic screenshots captured at failure
Crash reports grouped by OS version, hardware model, and GPU
Performance insights into your game via distributed tracing
Support for Linux, macOS, Windows, Android, and iOS
Note: Sentry also has console support for Nintendo Switch, Xbox, and PlayStation.
In addition to crash reporting, Sentry supports release health tracking, giving you insight into the stability of each release based on real-world usage. The SDK automatically captures session data, allowing you to monitor crash-free users and sessions, track adoption trends, and identify regressions introduced by new builds.
Prerequisites
To get started with the Sentry Unity SDK, you’ll need:
A Sentry account and a project configured
Unity 2019.4 or higher
The Sentry Unity SDK installed using the Unity Package Manager
If you’re not already using Sentry, you can sign up for a 14-day free trial.
Installing the Demo Unity Game
First, clone Sentaur Survivors from GitHub.
Next, add the game to Unity Hub:
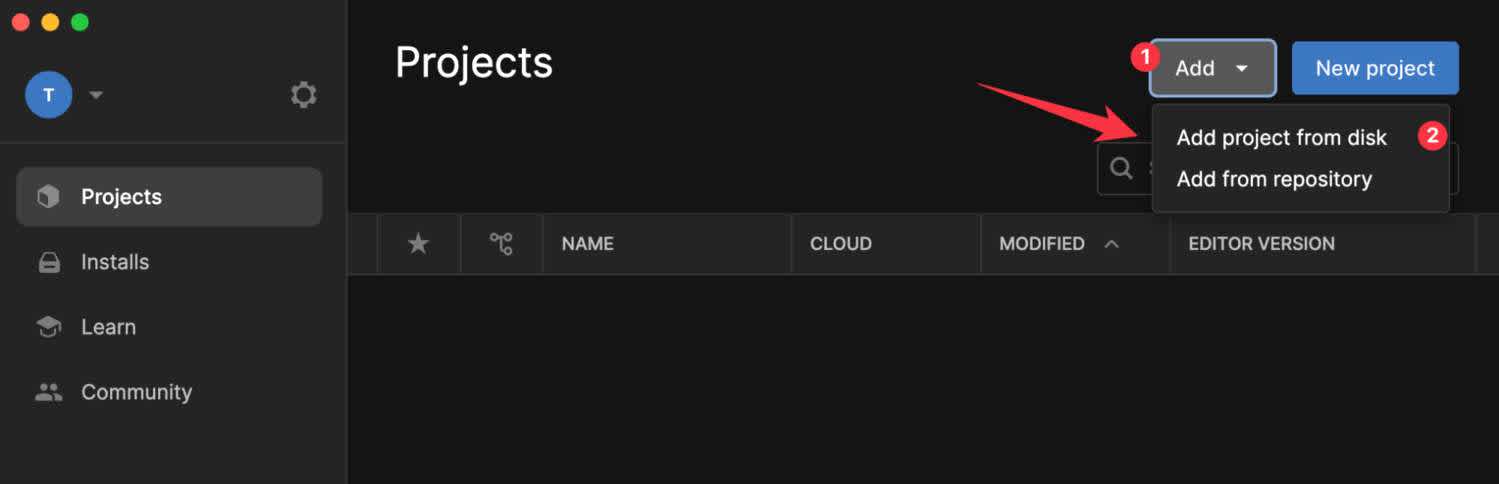
On the Projects modal, select the Add button at the top right.
Click Add project from disk and navigate to the root folder of the project cloned from GitHub.
Open game in Unity
The added game will show up in your list of projects. Double-click on it to open it in the Unity Editor. It may take a while for Unity to download the packages it needs.
Once the game is loaded, start it by going to the File menu, selecting Build and Run, and choosing a folder where the built version of the game will be saved.
You can also run the game from inside the editor by opening the TitleScene scene and clicking the Play button above the scene preview.
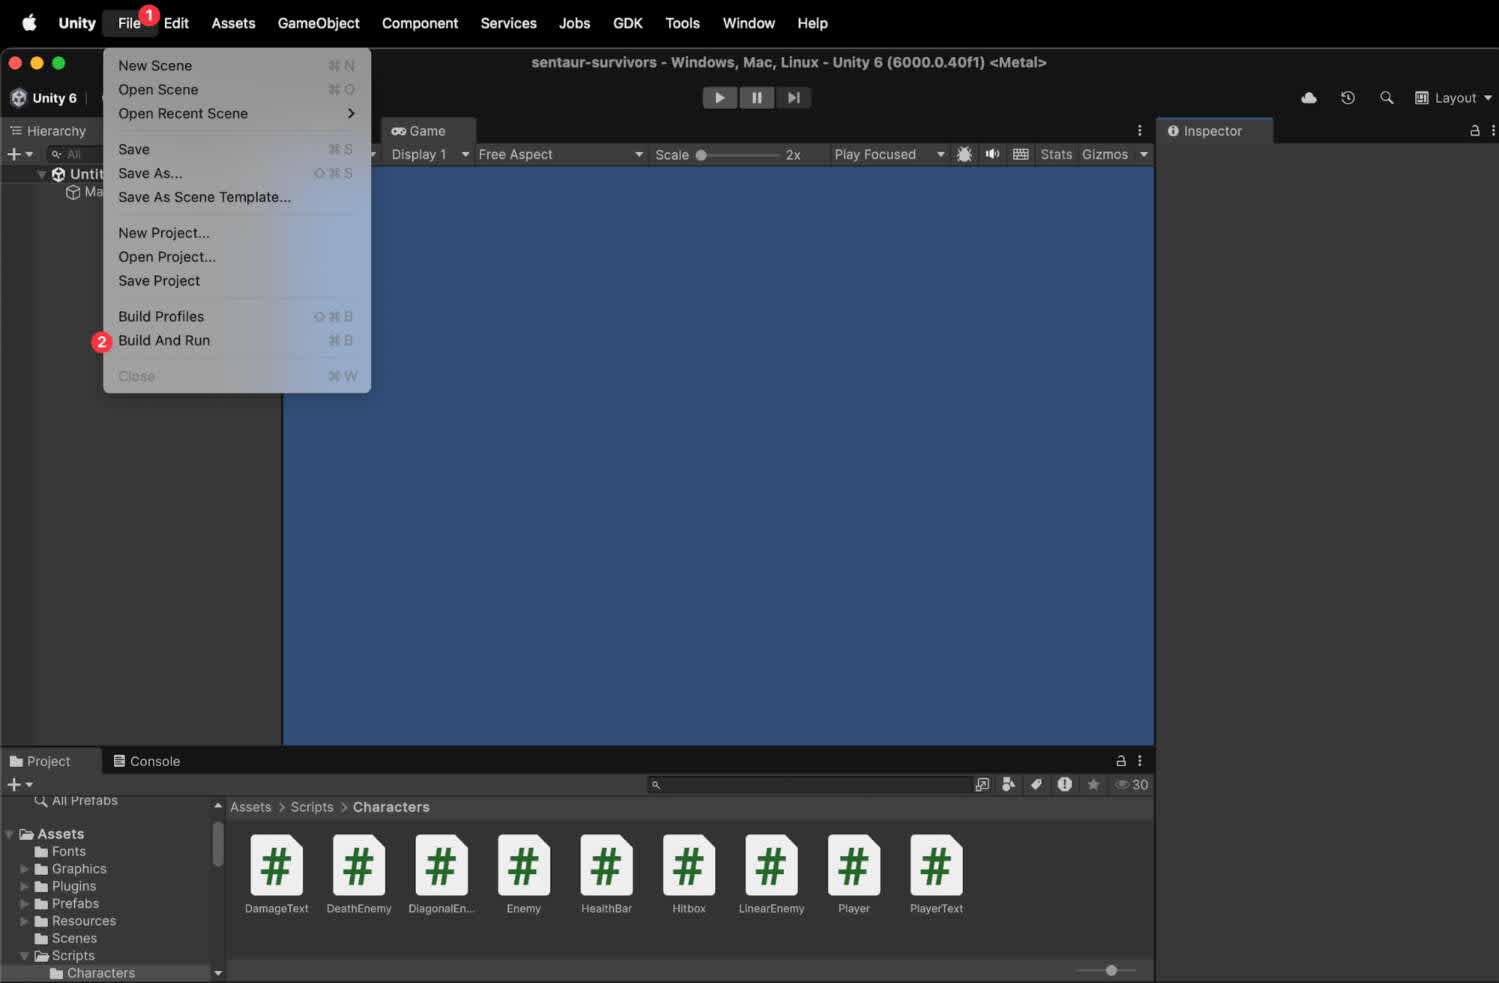
Locating the Build and Run option from the File menu in Unity Hub
Wait for the game to build.
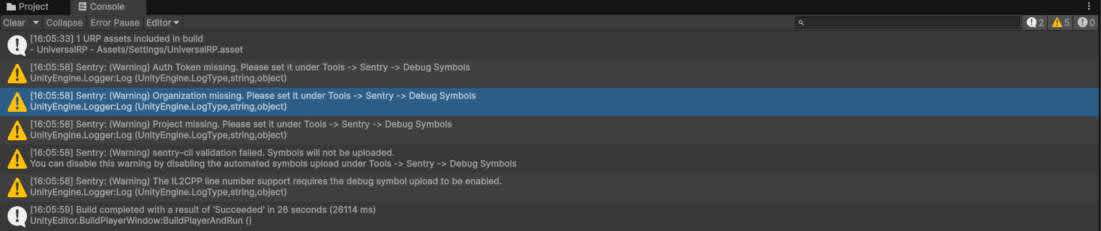
Game build logs
Once the build is finished, the game should start automatically.

Start game screen
Installing the Sentry Unity SDK
While the Sentry Unity SDK is already installed in the demo game, here’s how to add it to your own Unity project:
Open the Unity Package Manager, click the + (Add) button, and select Install package from git URL from the dropdown (more info here).
When prompted, add the following URL:
https://github.com/getsentry/unity.git
Configuring Sentry in Your Unity Project
If you're adding Sentry to your own project, a setup wizard will guide you through the configuration when you first open Tools -> Sentry.
In our case, Sentry is already added to the project so you will need to configure the SDK with your own Sentry account details to start capturing events. If you don't change this information, your game play errors will show up in our Sentry project, which won't help anyone!
You do this by setting the data source name (DSN) to tell the SDK where to send errors, and configuring your debug symbol upload credentials to enable readable Unity crash reports.
Set the DSN
Find your DSN in your Sentry project settings, under Client Keys (DSN). The URL will look something like this:
https://YOUR-ORG.sentry.io/settings/projects/YOUR-PROJECT/keys/In Unity:
Open the Tools menu.
Select Sentry to open the SDK configuration window.
In the Core tab, locate the DSN field.
Paste in your project’s DSN from Sentry.
Configure Debug Symbol Upload
To allow Sentry to automatically upload debug symbols and generate accurate native stack traces, do the following:
In Sentry, create an auth token and copy it.
Within your project, go to Tools -> Sentry -> Debug Symbols.
Add your auth token, then set your organization slug and project slug to match your Sentry project.
To see stack traces on the Sentry dashboard, enable the Upload Sources option in the Debug Symbols tab, and the Stacktrace For Logs option in the Enrichment tab.
For full setup instructions, see the Sentry Unity SDK documentation.
Now that the SDK is configured, Sentry will automatically upload debug symbols during builds – enabling readable native stack traces – and capture unhandled exceptions and Unity crashes. Here’s how issues will appear in your Sentry dashboard:
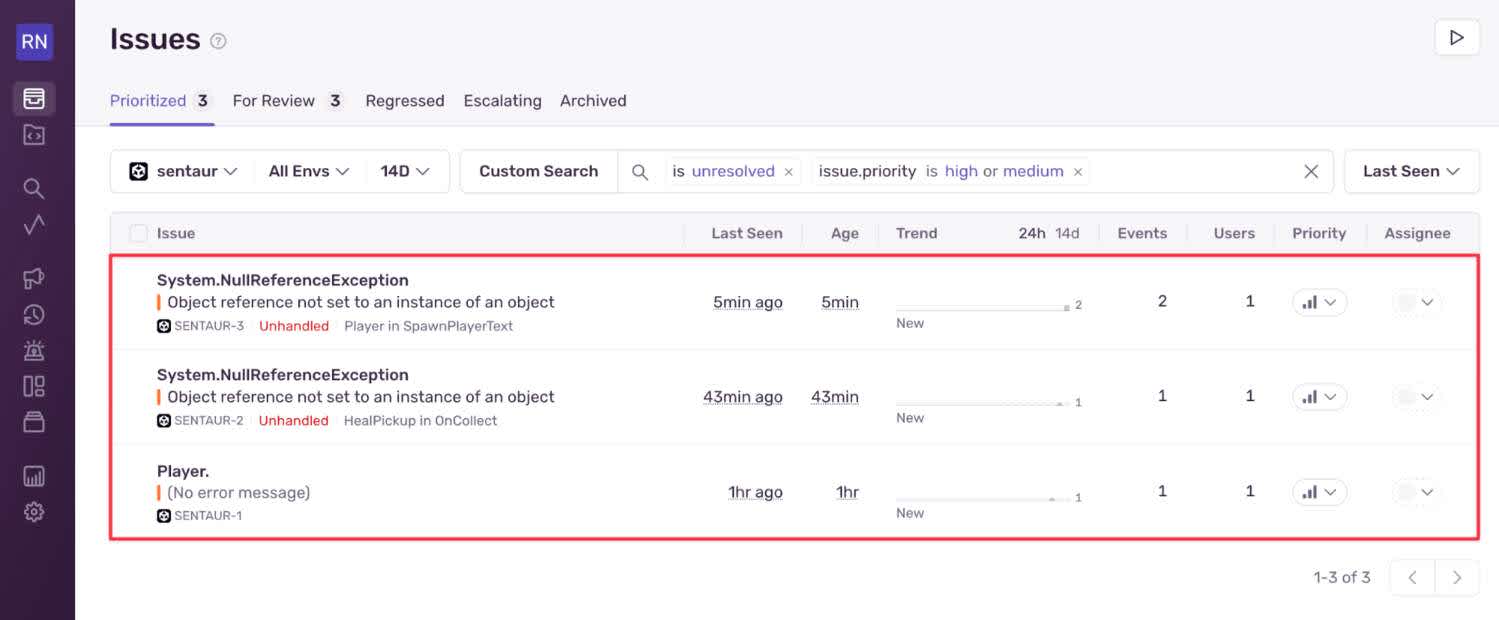
Sentry Issues
Example Error 1: Manually Logging an Error
To see how manually logged errors appear in Sentry, let’s insert a Debug.LogError call directly into the player character script.
In your project, open the sentaur-survivors/Assets/Scripts/Characters/Player.cs file and add the following line immediately before the code on line 143:
Debug.LogError("Player took damage.");The inserted Debug.LogError line will cause a log entry to appear when the player character takes damage. With the Sentry SDK active, this log is automatically captured and sent to your project in Sentry.
To include a complete stack trace in the error details view, navigate to Tools -> Sentry -> Enrichment and enable Stack Trace For Logs.
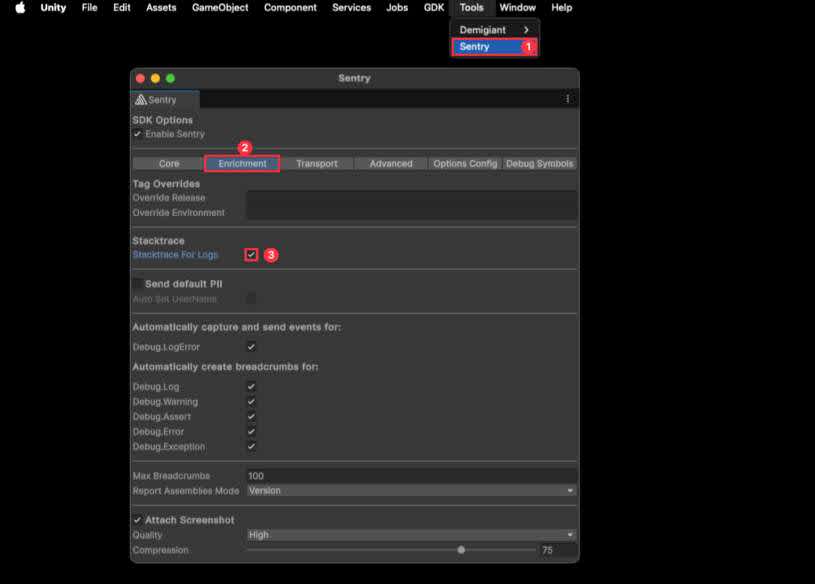
Enabling Stack Traces in Sentry
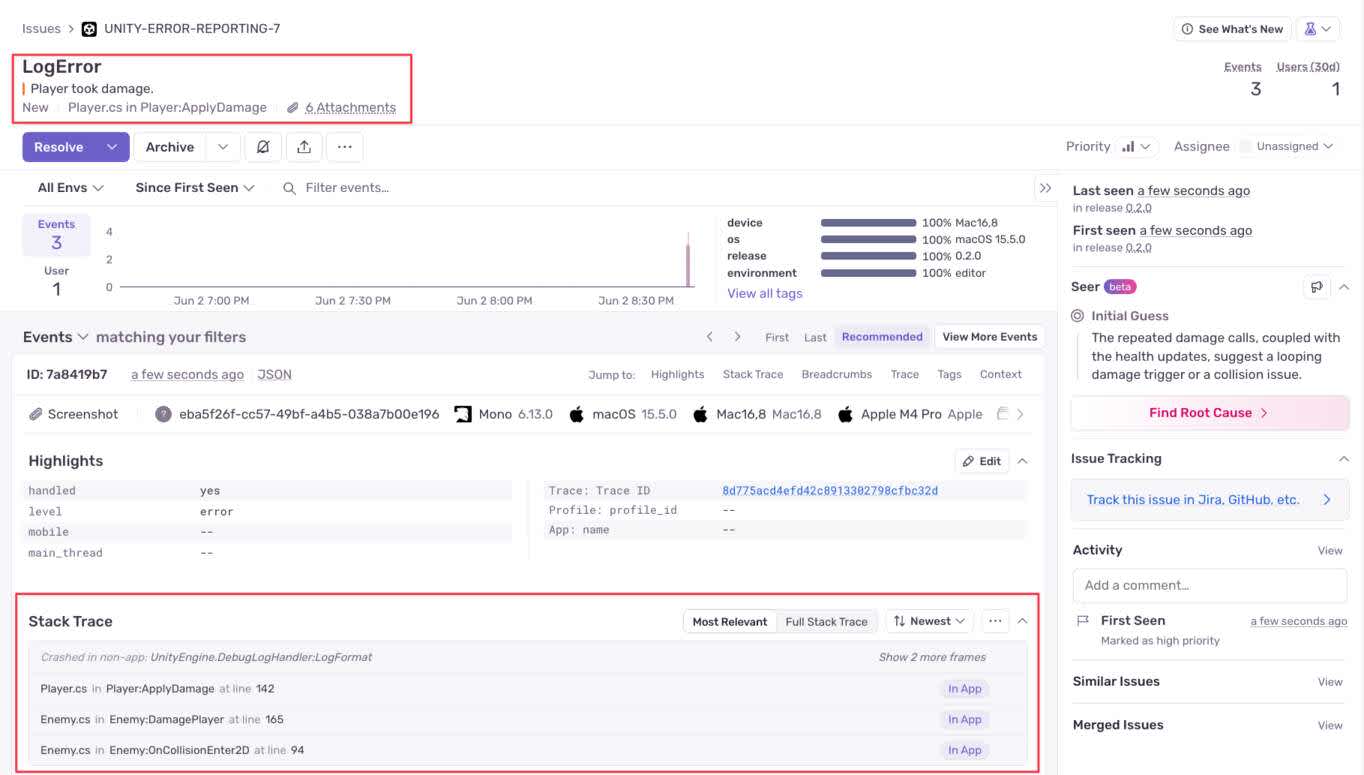
In the Sentry dashboard, this will appear as a non-fatal error event, with the following details:
The message “Player took damage.”
Contextual metadata about the runtime environment, including OS, Unity version, and hardware information.
The stack trace at the time of the log.
Breadcrumbs showing prior events (such as scene loads and earlier
Debug.Logcalls).If automatic screenshots are enabled in your configuration, you’ll also see a snapshot of the game screen at the moment the error was logged.
In the issue details, you can view breadcrumbs and a trace that captures the events leading up to the error:
Sentry issue trace
Breadcrumbs, extra context information, and scene hierarchy provide more troubleshooting insight than standard Unity console logs, which only show the file path and line number where the log originated.
Manually logging errors helps surface logic issues and unexpected conditions that don’t crash the game but still affect gameplay — especially those that players wouldn’t report.
Example Error 2: Missing GameObject After Scene Hierarchy Destruction
GameObject After Scene Hierarchy DestructionNow let’s simulate an issue where a script attempts to access a GameObject that no longer exists in the scene hierarchy. These errors can be tricky to debug in production, so capturing them makes troubleshooting easier.
Run the game in the editor by hitting the Play button in the top toolbar while the TitleScene is open. When the game is running, select New Game to load the BattleScene.
You can now remove the SoundManager GameObject. Select it in the Scene Hierarchy panel. Find it in BattleScene under the Managers object. The next time the game tries to play a sound, a MissingReferenceException will be thrown and Sentry will capture the error.
You can watch the following video for a complete walkthrough of this scenario, from removing the SoundManager to seeing the error captured in Sentry:
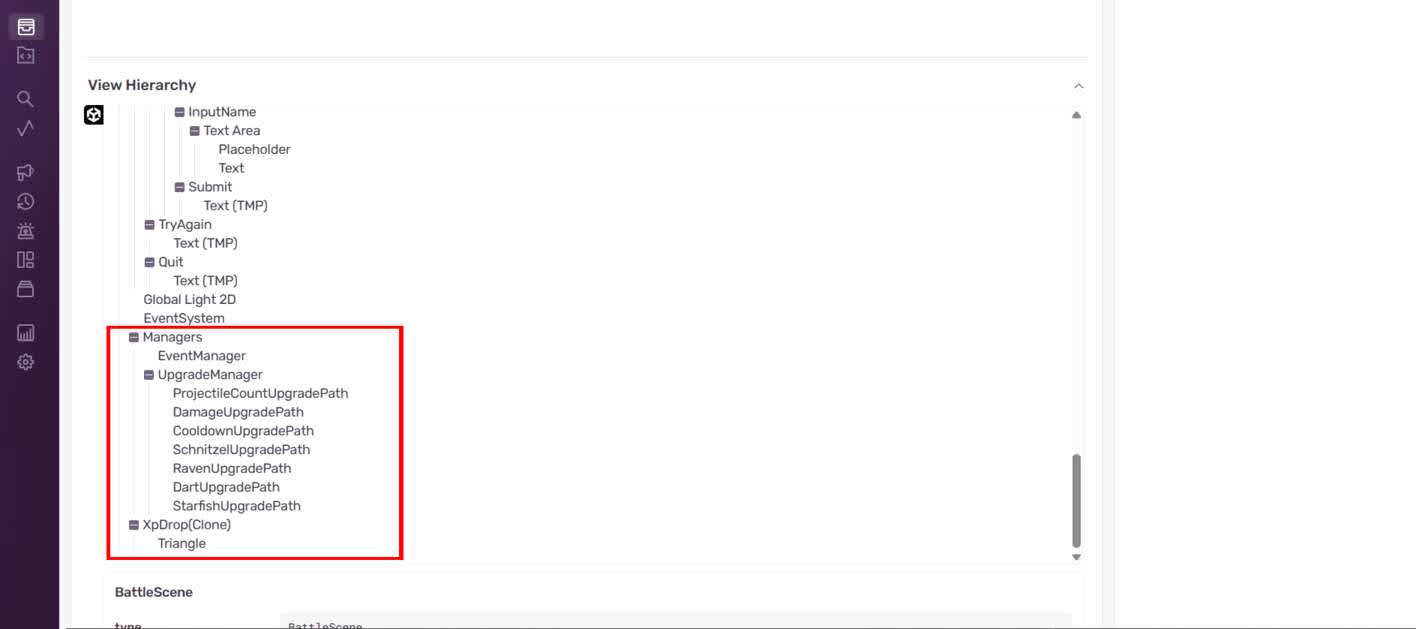
On the Sentry dashboard, the issue screen shows details of the script file and line number where the error occurred. The View Hierarchy section will show you which game objects are loaded at the time of the error, for example, the SoundManager GameObject will be missing from the View Hierarchy list of objects.
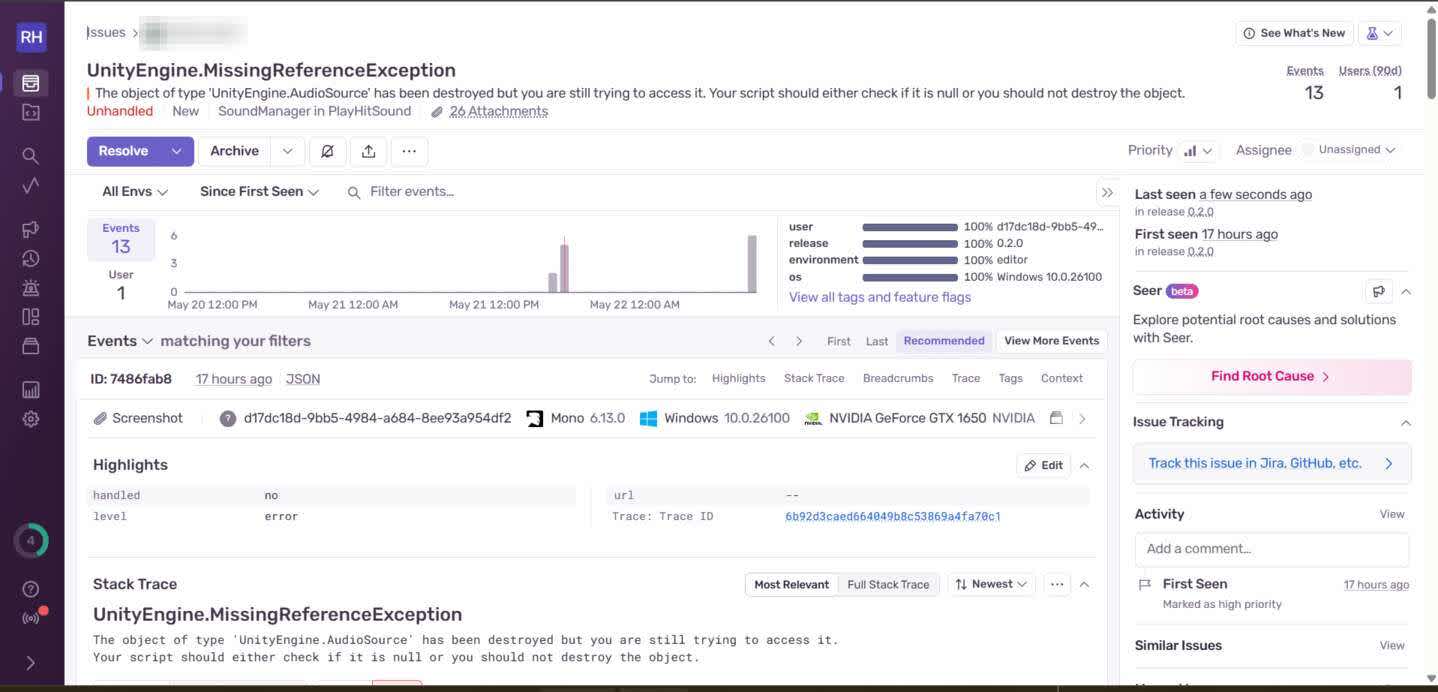
Sentry dashboard showing the issue details
The stack trace view shows more details about the error.
Sentry issue stack trace view
When these kinds of errors occur in production, Sentry generates crash reports that show exactly where in your code a dynamically removed GameObject is being accessed. This helps you identify and fix issues where a GameObject is destroyed too early.
Example Error 3: Missing Serialized Field in a Prefab
Next, let’s see how Sentry handles errors caused by a missing reference in a prefab, which can happen during prefab refactoring or merging. Missing prefab references can be tricky to diagnose live, so capturing them with an error reporting system makes them easier to detect and resolve.
Open the Assets/Prefabs/Characters/Player prefab in the Unity Editor.
In the Inspector panel, find the Player component. Look for the Player Text Prefab field, which should have a prefab name set in the input box.
Delete the reference assigned to this field. Click the small circle to the right, select None (or use the delete key), and save the prefab. Now build and run the game.
When the game runs, it will throw a NullReferenceException whenever it tries to spawn player text.
Here’s how the error appears in the Sentry dashboard with gameplay screenshots:
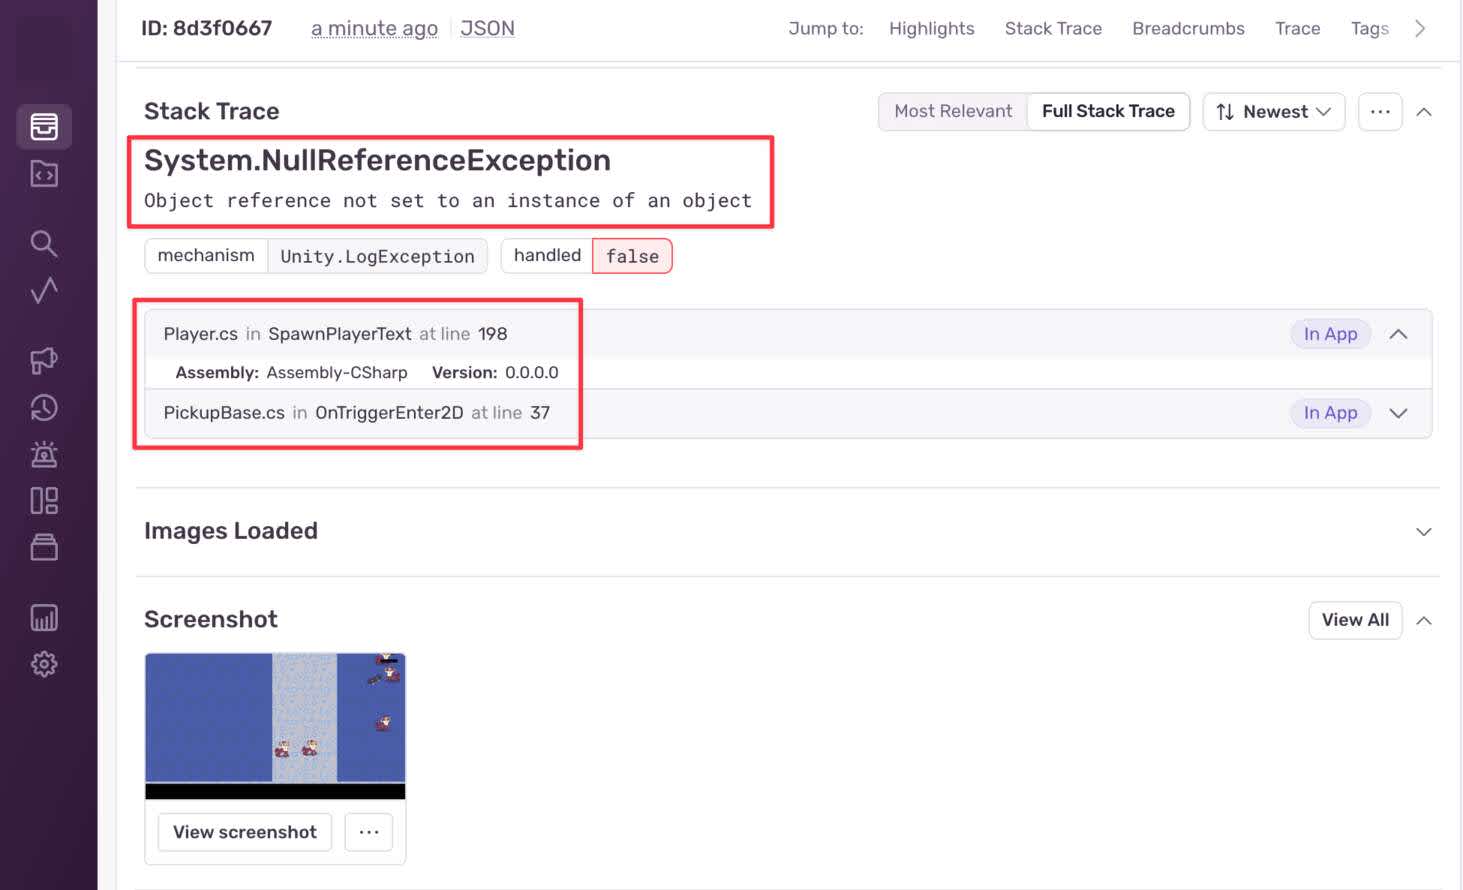
Issue in the Sentry dashboard with gameplay screenshots
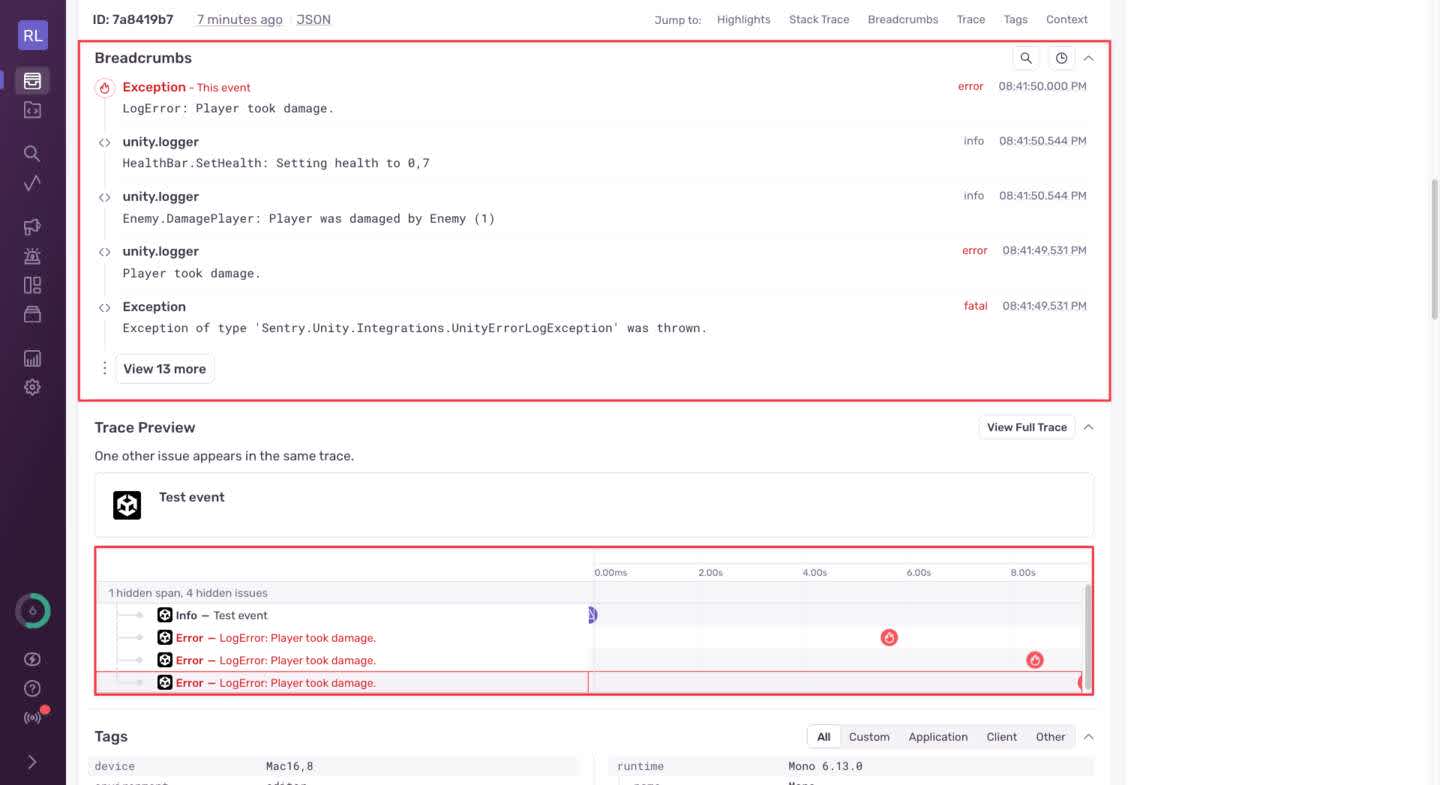
You can also view the error breadcrumbs and trace preview:
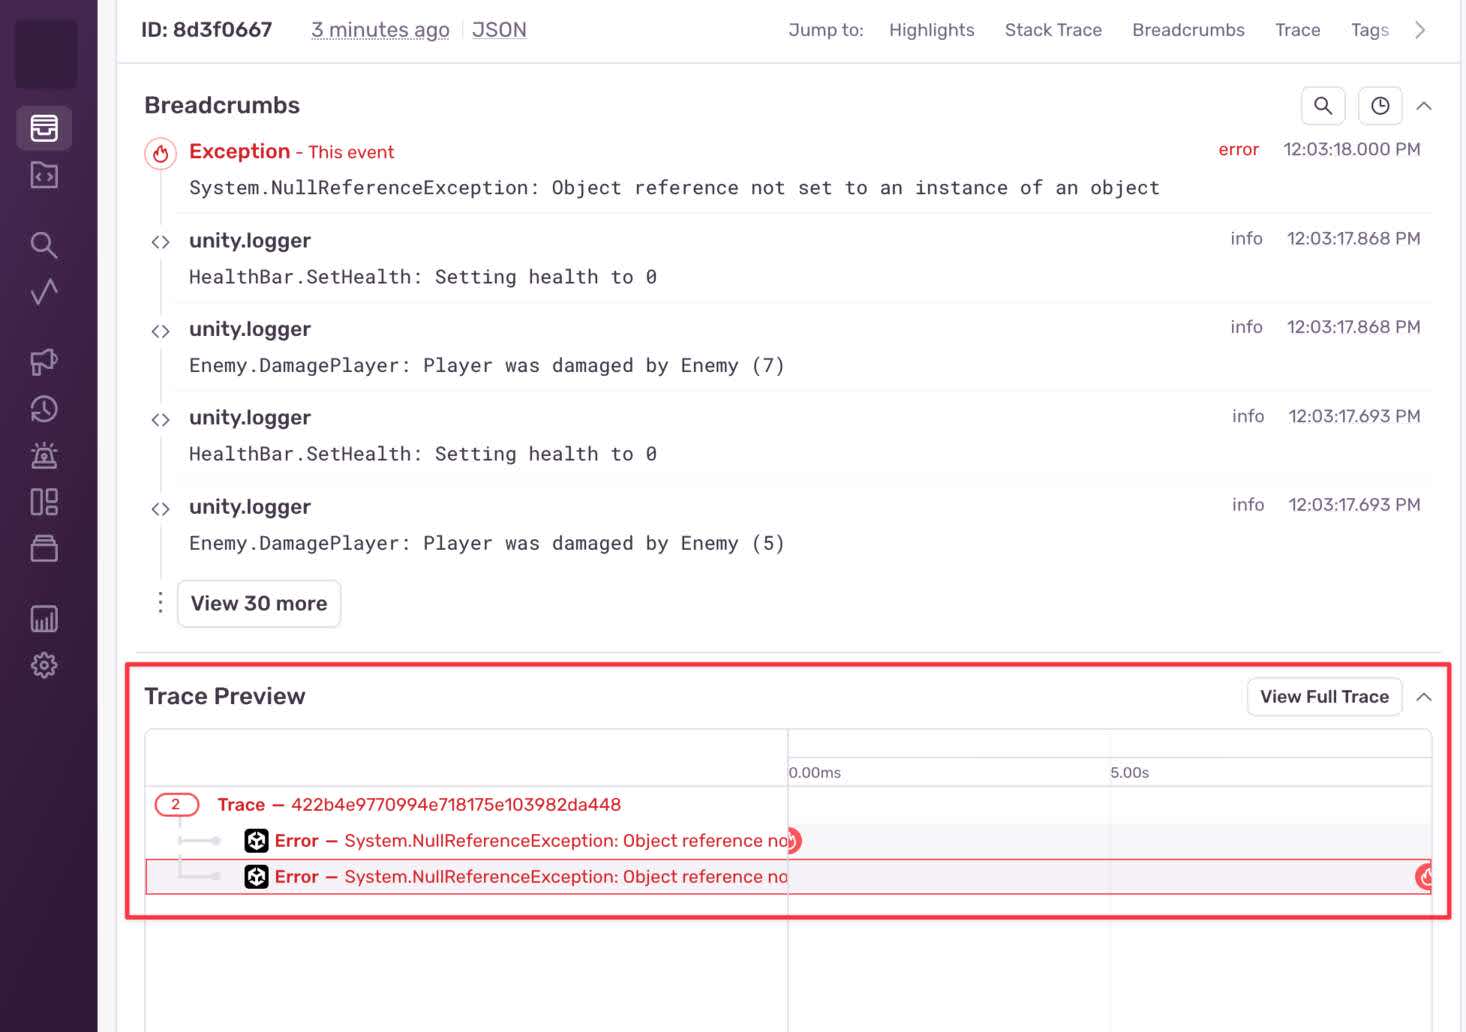
Sentry issue breadcrumbs and trace preview
Sentry’s Unity error monitoring captures these errors when they occur, making it easier to locate the missing reference and fix the broken prefab. Sentry can also upload a screenshot taken at the moment of the error, helping you visualize the game state and identify problems during complex scenarios.
What Sentry Captures for This Error
Sentry will automatically group these repeated exceptions under a single issue. In the dashboard, you’ll see:
Exception type: In this case,
NullReferenceException.Affected file: The script where the prefab field is accessed (for example,
Player.cs).Stack trace: Pointing to the line where the unassigned field is used.
Breadcrumbs: Including the chain of calls or player actions leading to the error.
Environment metadata: Unity version, OS, hardware, and graphics API.
Release tagging: Identifies whether the issue only affects specific builds.
Grouping: Multiple reports of the same exception will appear under one issue, with counts and frequency tracking.
This type of error is difficult to catch without automated reporting because it’s often introduced accidentally and can go unnoticed until runtime – especially in builds with limited logging.
Tip: Grouped issues show you how often an error happens and where, while tags and context metadata help you quickly spot patterns across environments.
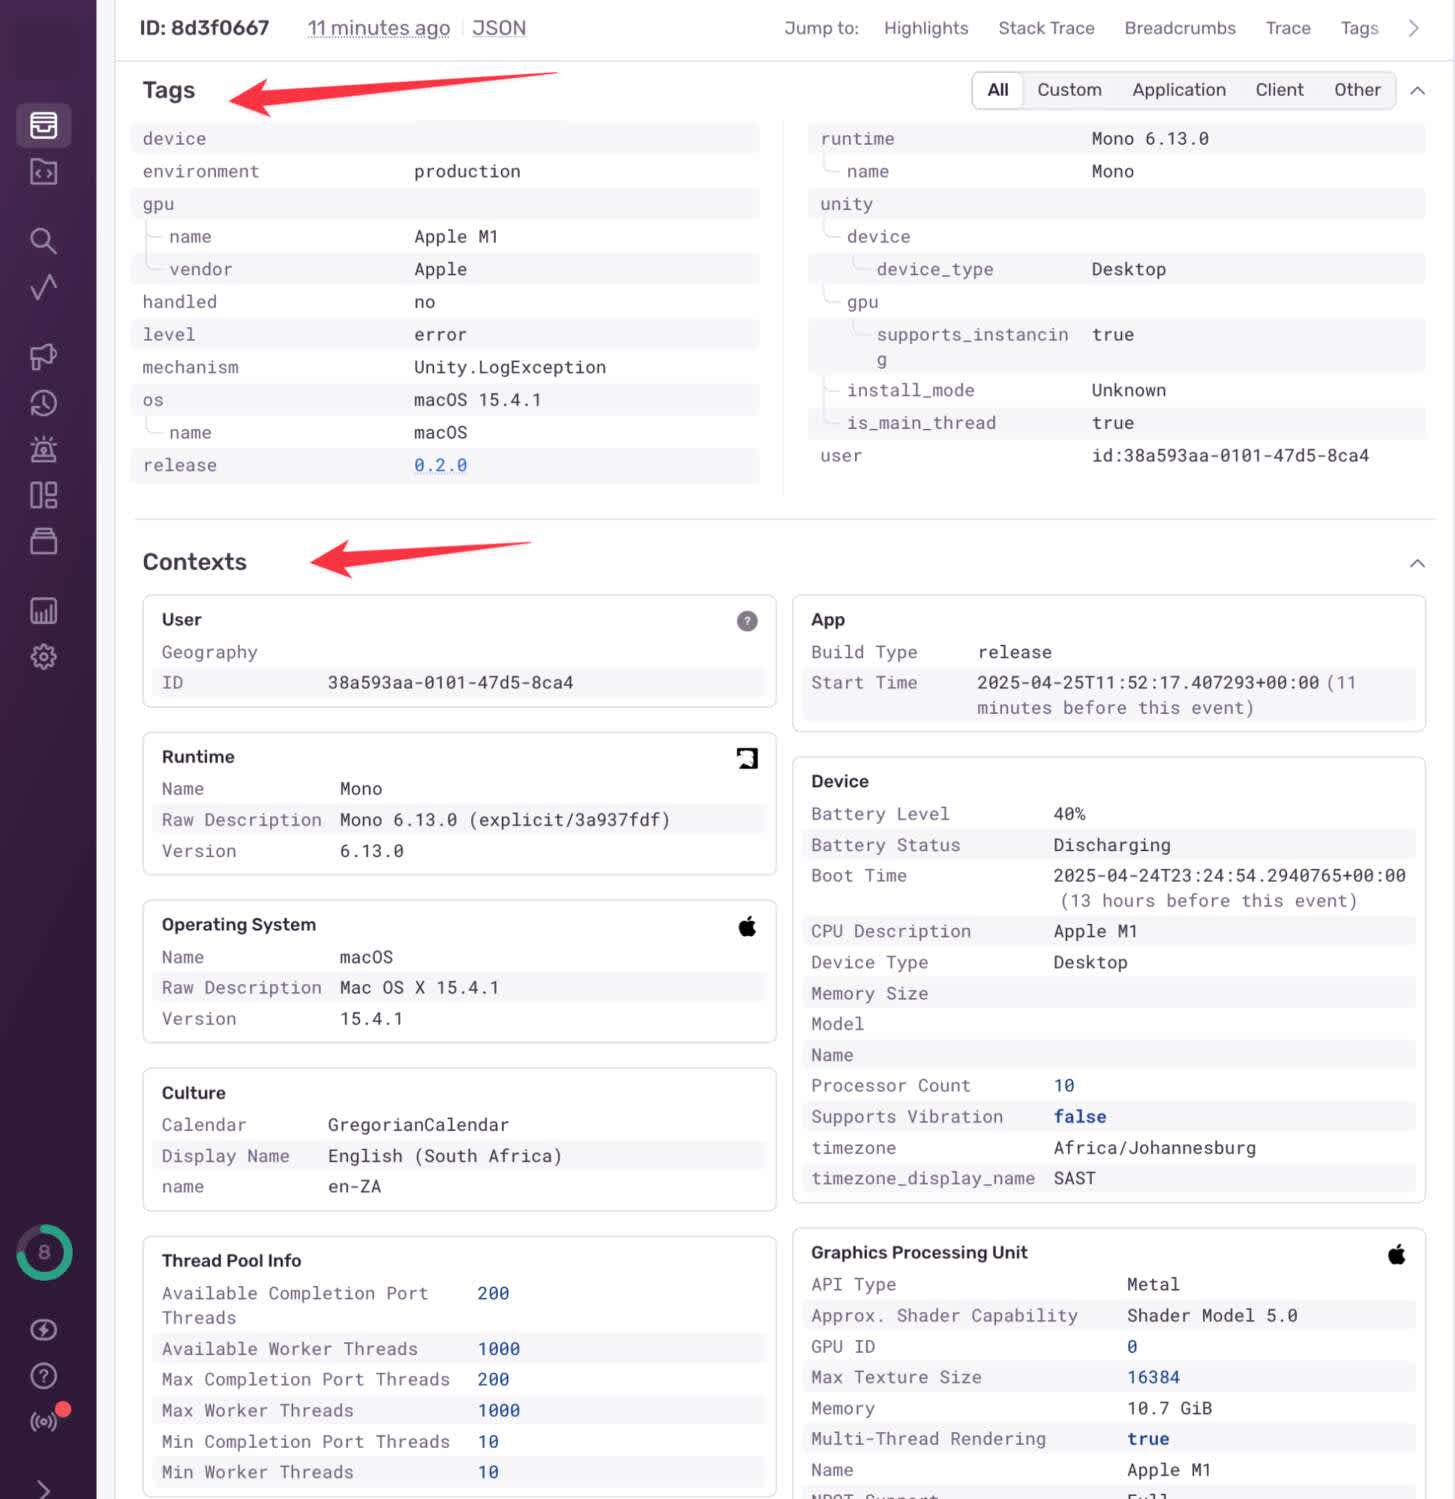
Sentry dashboard showing issue context
Tip: You can also view the scene hierarchy at the time of the error to see exactly what objects were present – useful for diagnosing missing or destroyed GameObjects.
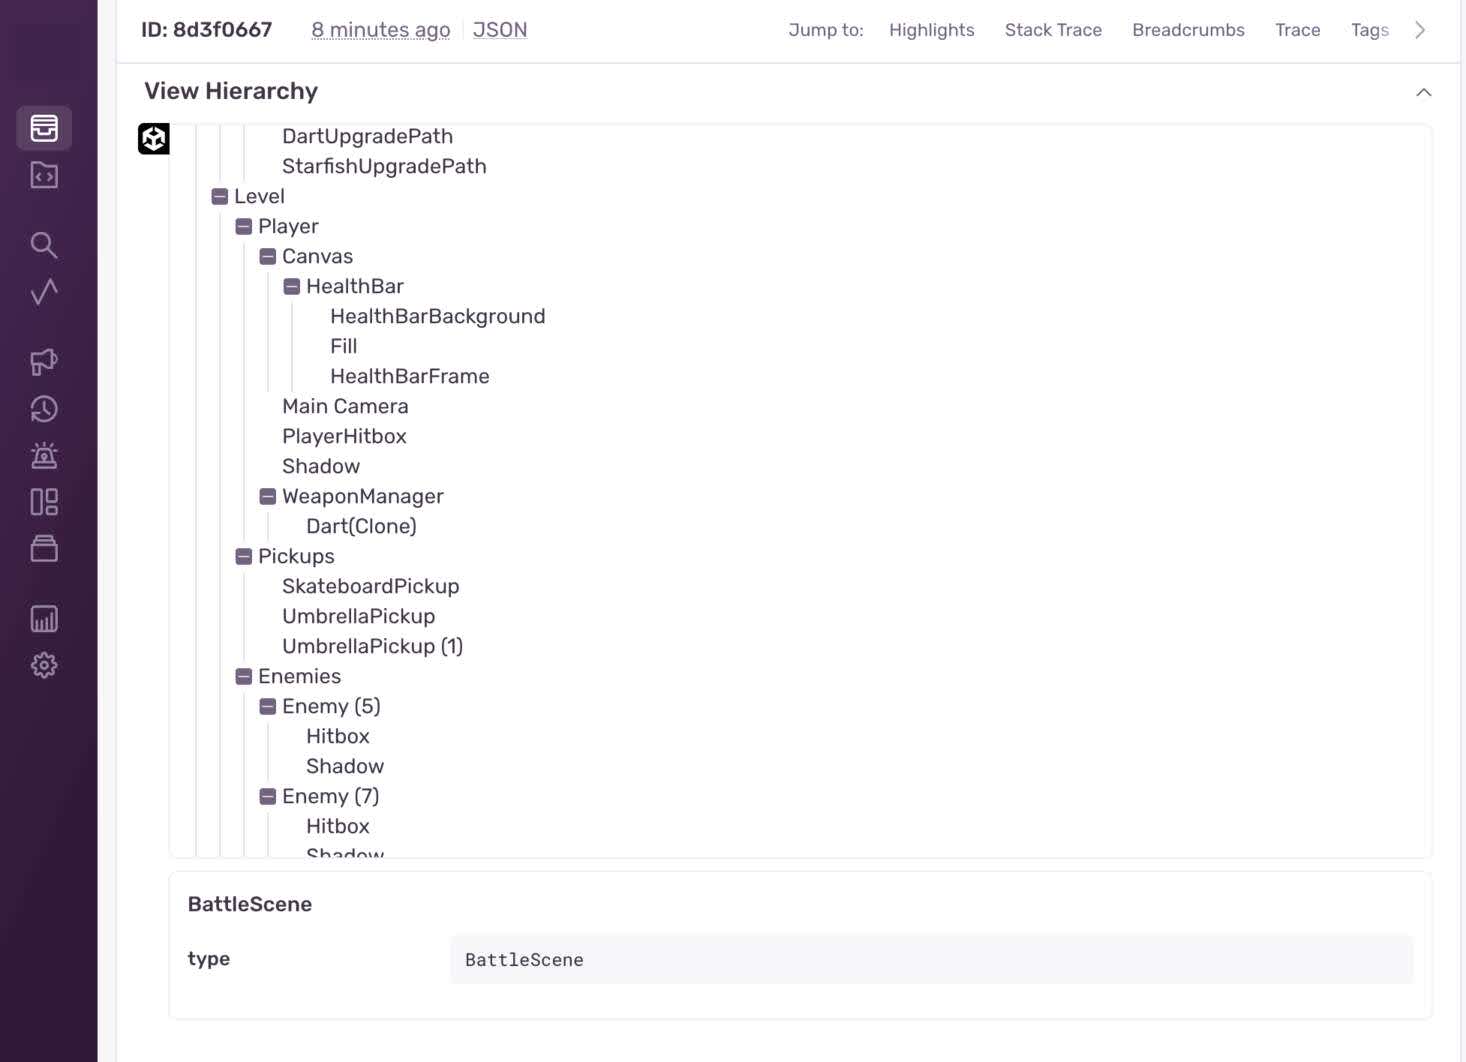
Sentry issue scene hierarchy
The rich diagnostic data that Sentry provides alongside error reports is valuable for identifying Unity errors that occur only on a specific platform or operating system – without needing to wait for enough players to report the problem manually, which often makes pattern detection in compatibility issues slow and unreliable.
This combination of tools and metadata makes it easier to debug issues across device types and conditions (like mobile environments) by revealing patterns that are difficult to spot in the wild, such as low battery status or errors tied to specific device makes and models. Visibility into when a specific context variable causes an issue enables you to release quick, targeted fixes without relying on trial and error.
Remove the Guesswork in Unity Debugging
The Sentry Unity SDK helps game devs more easily troubleshoot common but tricky errors (like NullReferenceException) caused by missing objects or unassigned fields, and captures valuable context when you manually log errors.
For games in production, Sentry also provides release health tracking – giving you a high-level view of crash-free sessions, user adoption, and regression errors tied to a specific build. Whether you’re shipping on desktop, mobile, or consoles, Sentry gives you the tools to detect, diagnose, and resolve issues faster – without relying on player bug reports or guesswork.
Get started with Sentry on a free Developer plan, explore additional features with a 14-day trial of the Team or Business tiers, or dive straight into the Sentry Unity SDK if you already have an account. We're also on Discord where real-life Sentaurs are ready to chat about anything Sentry.
