September Product Updates for Sentry
September Product Updates for Sentry
It’s official, summer is over. So grab yourself a pumpkin-spiced food item of choice and check out what the Sentry team has been up to this past month. From introducing new features, product improvements, and integrations, we can objectively say we made Sentry at least a smidge better this month. Keep reading to see how the latest developments can make your debugging experience less painful.
Slow Database Queries with Query Insights
Whenever a user logs in, searches within your app, or does… well just about anything where a record is updated, added, or deleted, your users are hitting one of your many databases. Query Insights shows query-specific performance metrics to pinpoint when the slowdown happened, which API endpoints it could be affecting, and all the event context you need to identify and fix the root cause. Peek at this blog to learn more or if you’ve already used it, tell us what you think on GitHub.
Find Trending Issues Fast with Escalating issues
Is your Issue Stream cluttered with non-urgent issues because you don’t want to Ignore an issue in case it starts trending? Good news. You can Archive an issue to remove it from the main Issue stream until it becomes worse (i.e. starts escalating). If the frequency and potential impact of an Archived issue increases, Sentry will automatically resurface it in the main Issue stream and tag it as Escalating. Unlike Ignoring issues, by Archiving you can clean up your issue stream and plan for Sentry to notify you if it regresses.
When you Archive an issue, it’ll show up in the new Escalating tab if it starts trending. Note that the Archive action is replacing Ignore. By Archiving, you can trust Sentry to tell you when the issue needs your attention. Learn more about the feature here, and share your feedback on GitHub.
OpsGenie Integration
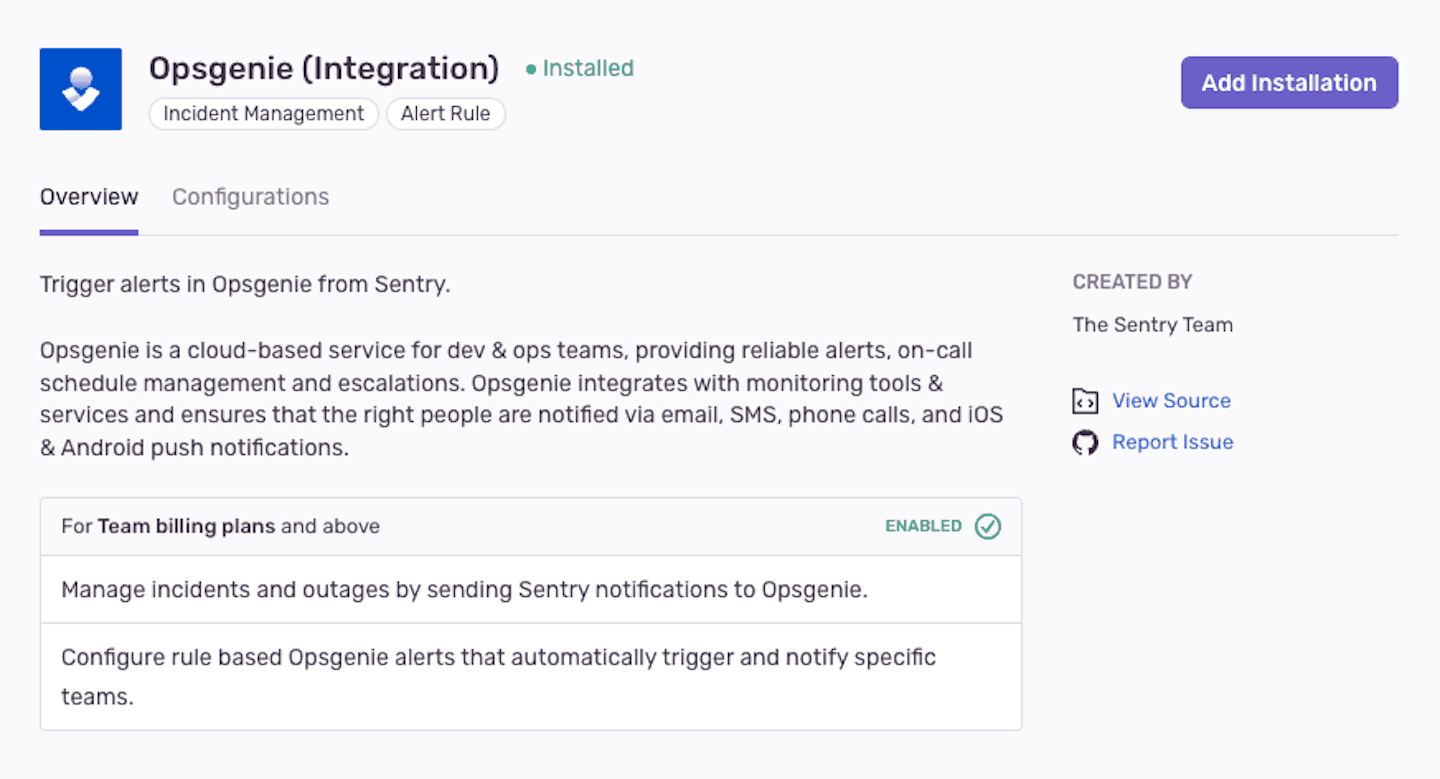
Never miss a critical incident by integrating Opsgenie with Sentry. You can now connect your Sentry organization to one or more Opsgenie accounts, and configure alerts in Sentry to notify teams in Opsgenie. Check out the docs to get started.
Profiling CPU and Memory Usage for Mobile
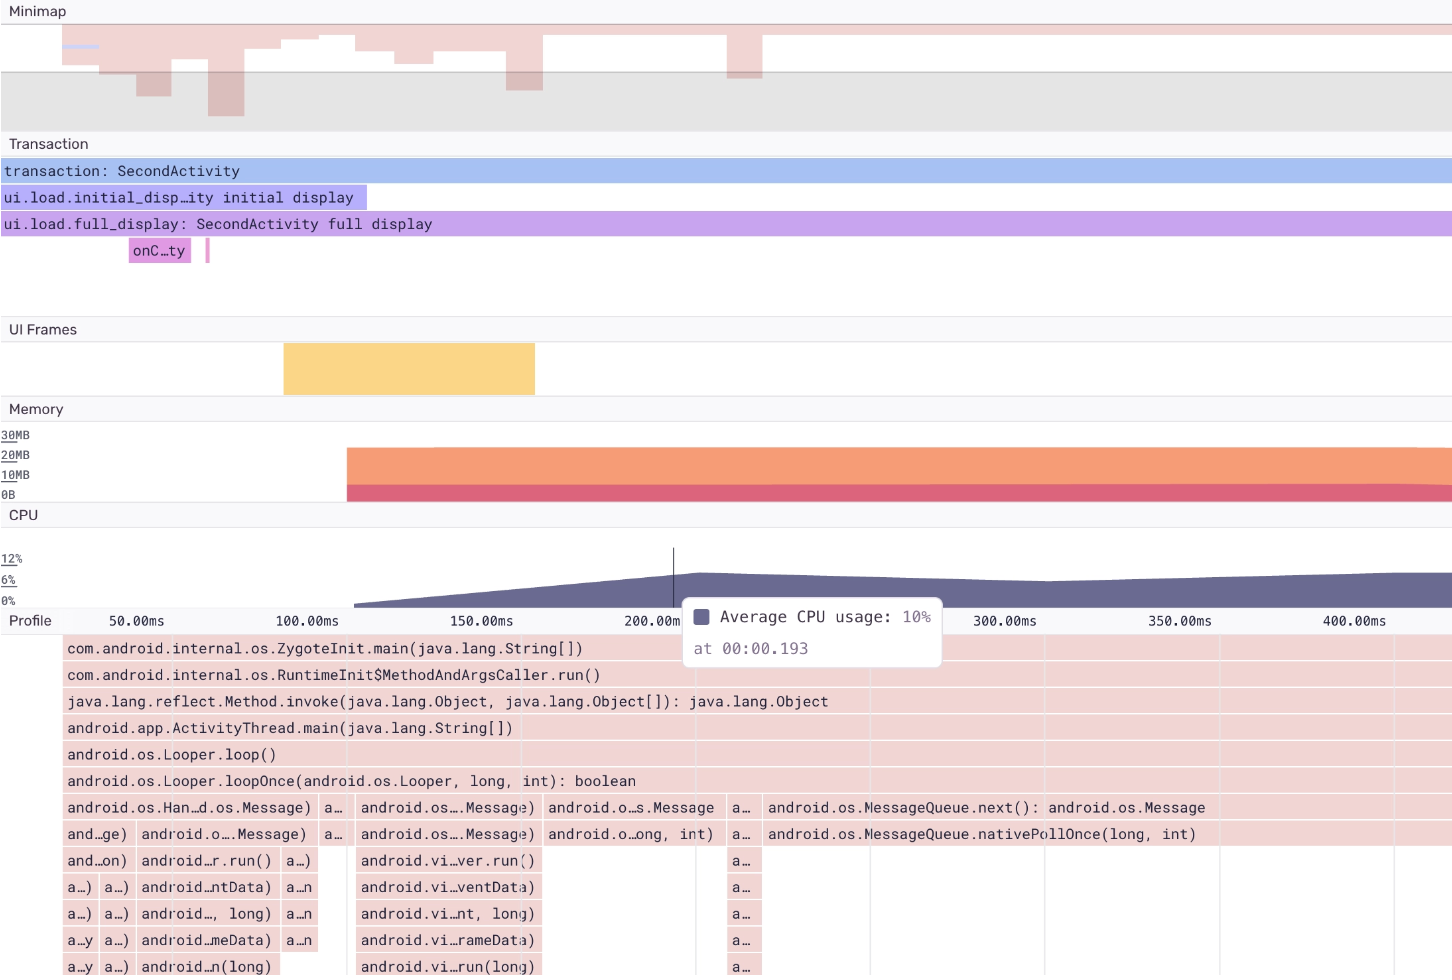
Sentry Profiling gives you code-level insights about your app in production so you can quickly see which functions are contributing to slow spans — allowing you to fix what’s urgent fast. As performance for mobile apps can vary widely depending on the device it’s running on, understanding hardware usage is key for fast performance. To help mobile developers understand resource requirements for their code, Profiling now supports viewing CPU and Memory usage overtime for iOS and Android. If you aren’t using Profiling today, get started here.
To stay up-to-date on the latest from Sentry and our performance monitoring capabilities, our changelog has the running list of all product and feature releases. You can also drop us a line on GitHub, Twitter, or our Discord. And if you’re new to Sentry, you can try it for free today or request a demo to get started.


