Small improvements add up to big updates at Sentry
Small improvements add up to big updates at Sentry
It’s the little things that can make a big difference. While we announced significant product updates like Autofix and Metrics (to name a few) during Launch Week, we couldn’t cover everything. Over the past few months, we shipped updates to the core platform, improvements to the developer workflow, and a series of quality-of-life features. The sum of these small improvements add up to big updates across Sentry that help make your production issues even more debuggable.
Core platform: Replay context & more actionable issues
Hydration Diff Tool
No matter the SDK or framework, errors are bound to happen. And for Next.js, one of the most frustrating to solve can be hydration errors. If you’re using Next.js with Session Replay, you can now display a diff of the page before and after React has hydrated. The new Hydration Diff tool helps you find the element or attribute that caused the hydration error. Learn more.
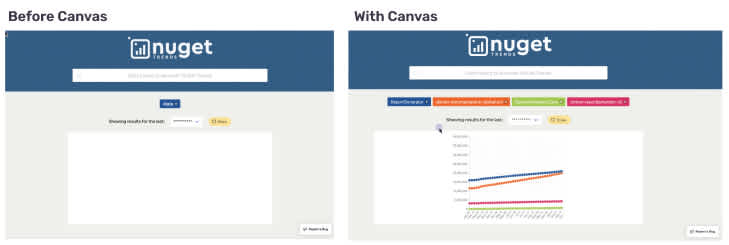
Canvas Support for Session Replay
For all websites/apps that leverage HTML canvas elements, you can now configure replays to show canvas elements (Beta). This gives you the context and insight you need to debug tricky errors in your application related to those elements, and better understand the severity of those errors. Learn more.
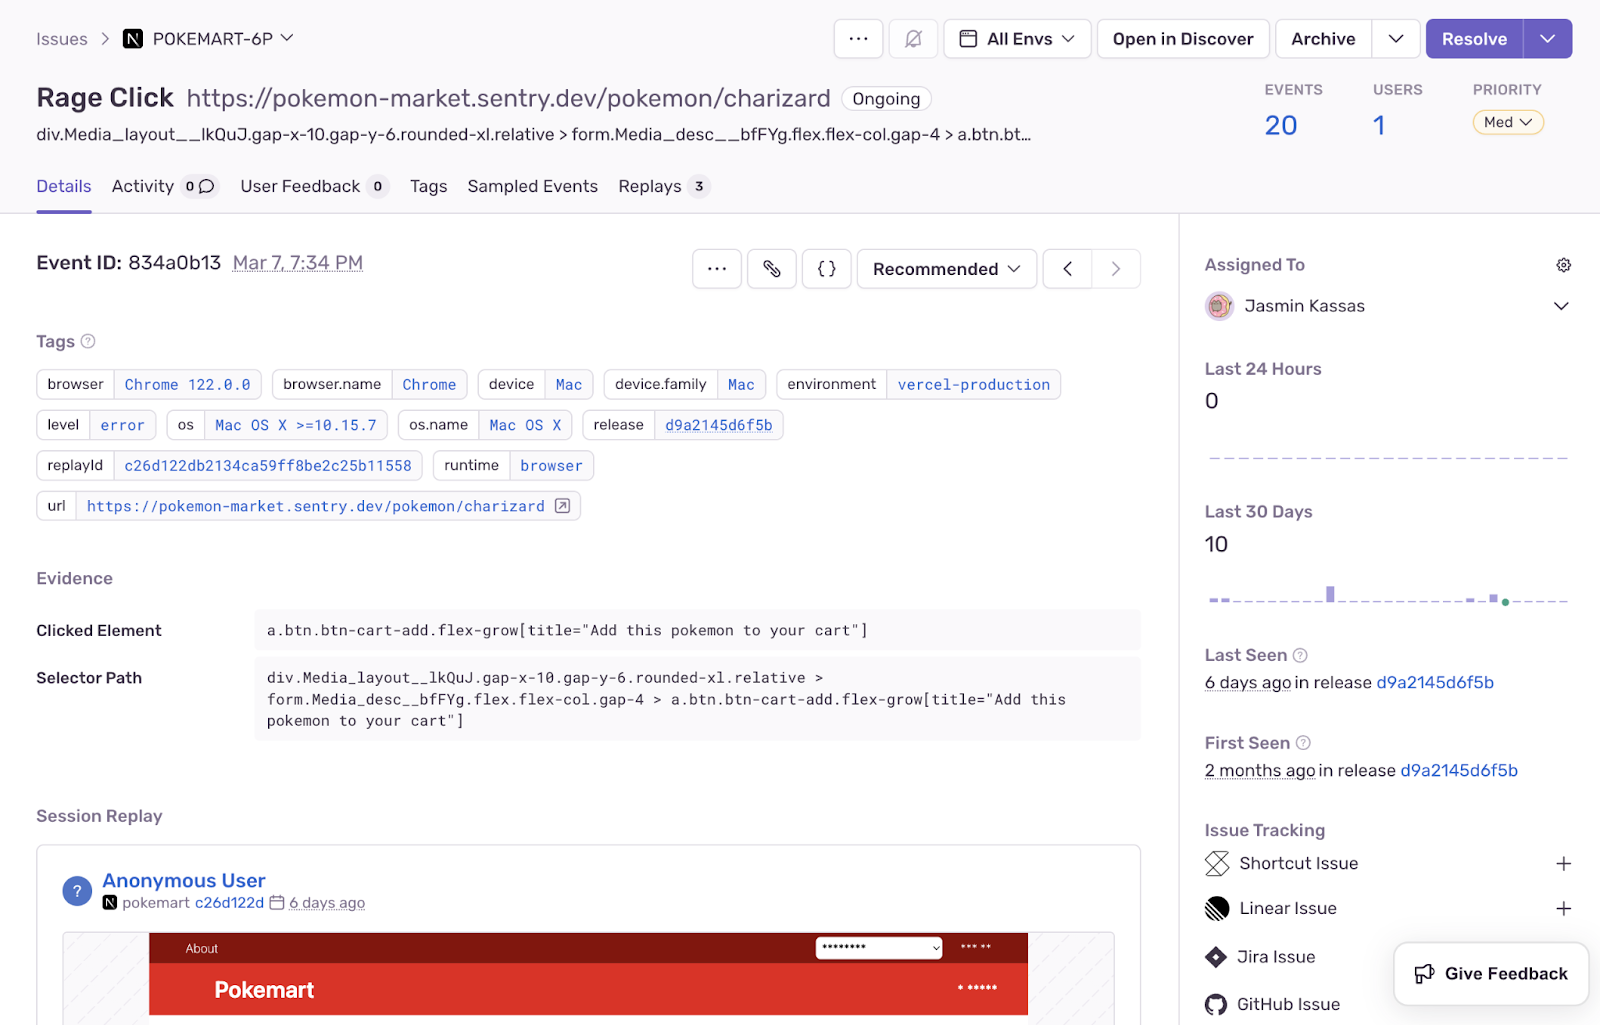
New Rage Click Issue
Are users smashing buttons on your site expecting something to happen? Now you can get alerted to rage clicks within Sentry to take action on them as soon as they occur. With rage click issues, you can get all the handy workflow components that come with Sentry issues to triage your rage clicks (i.e., resolve, assign, archive, etc.) as well as the debugging context needed to resolve them.
Mute the Noise with Better Inbound Filters
We also improved inbound filters to eliminate issues that aren’t actionable. This included updating legacy browser filters and enabling them for new projects by default (existing projects coming soon). This should reduce the number of noisy, unactionable issues you get related to things outside of your app (e.g. browser extensions).
Updated Trace View with new Timeline
Ever wonder how issues within the same trace relate to each other? The issue details page now shows a trace timeline that displays up to 100 other issues within the current event’s trace. You can navigate to all related errors and spans in the trace by clicking “View Full Trace." Check out Trace Navigator in action below.
Workflow: GitHub PR comments, Slack context, & OpsGenie and PagerDuty alert priority
Change Alert Priority for OpsGenie and PagerDuty Alerts
We love bringing customers in when building out our product roadmap. Sentry customers Razorpay and Miro brought to our attention that every alert sent to PagerDuty and OpsGenie was marked as P1 or critical (PagerDuty and OpsGenie GitHub Issues). Now, for customers using OpsGenie and PagerDuty, you can select the severity in which you want to be alerted to in both Metric and Issue Alerts. Learn more.
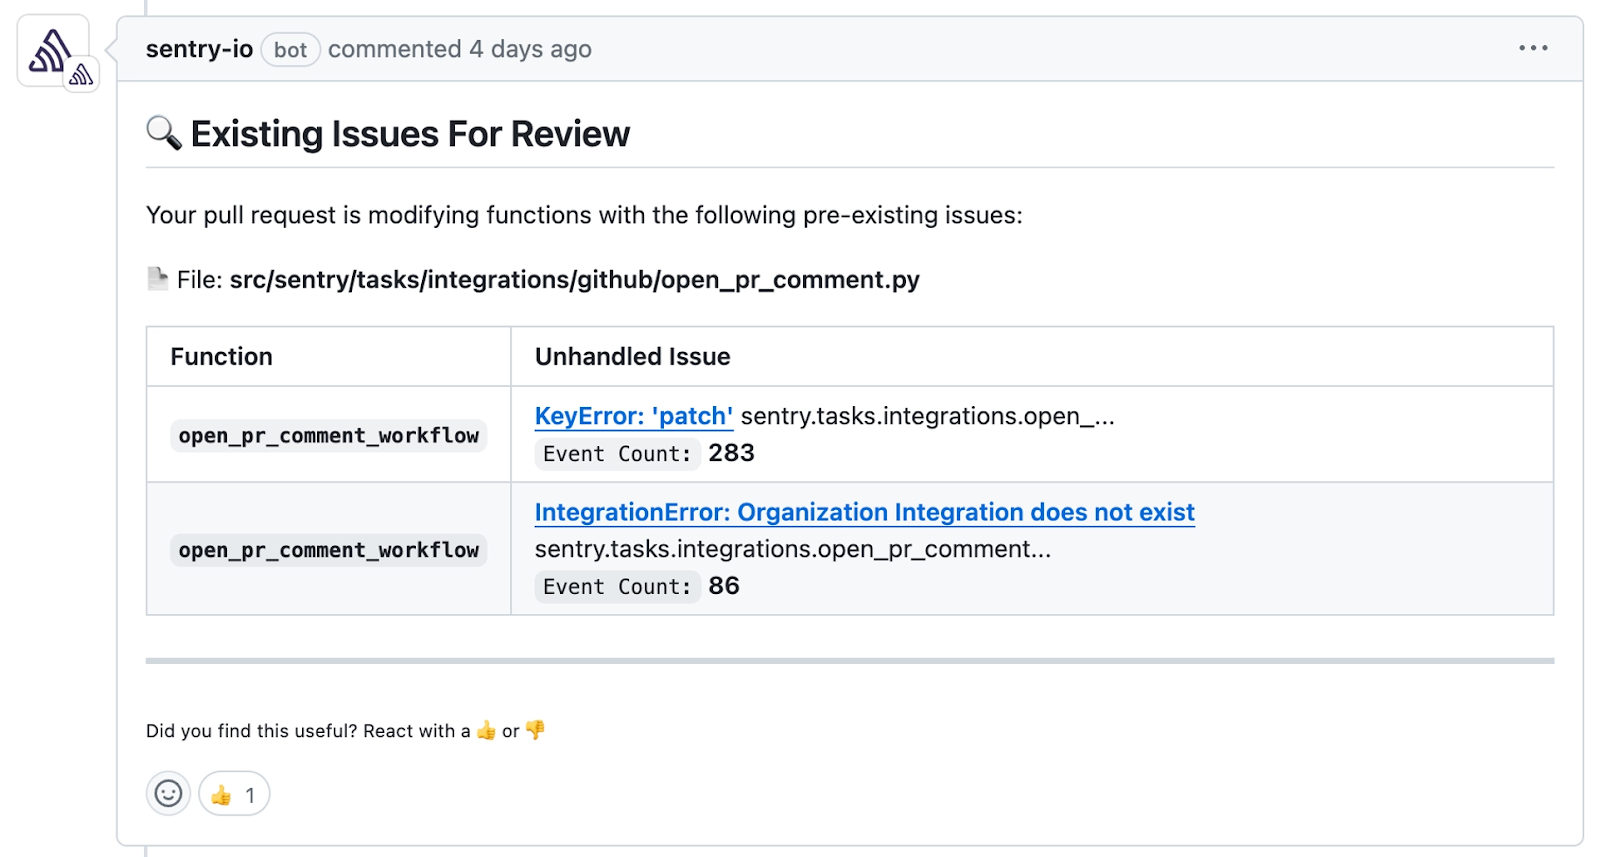
GitHub Pull Request Comments
Sentry will now comment on your GitHub pull requests, so you don’t forget to fix unresolved issues. If you’ve connected Sentry to GitHub and enabled Stack Trace Linking, when you open a new pull request, Sentry will comment to tell you if there are unhandled issues caused by the functions you are modifying in your PR. Learn more.
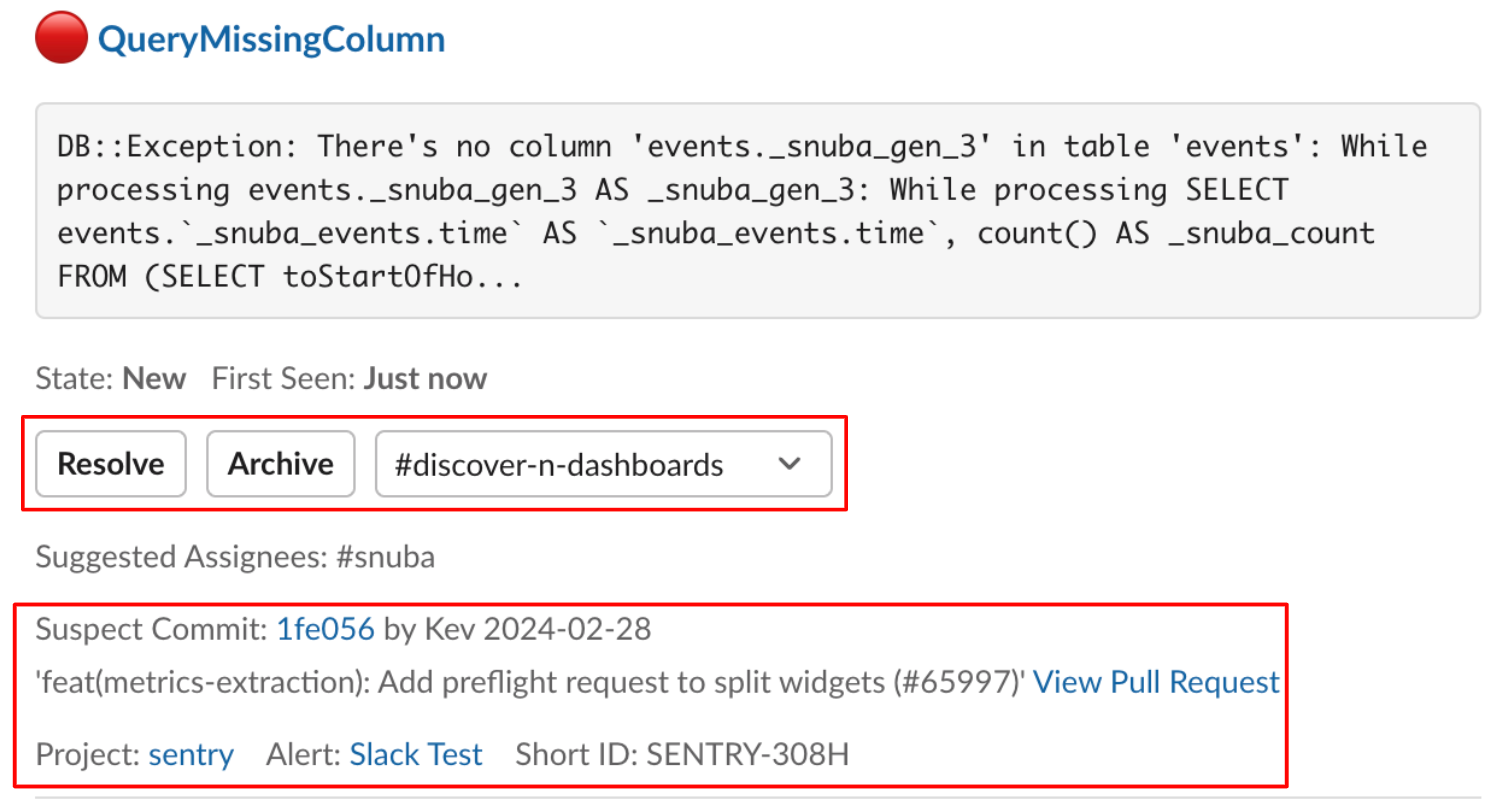
More Context in Slack Alerts
Many teams rely on Sentry to notify them over Slack. We’ve just released an update to our Slack integration to make Slack messages more actionable. Now, when you receive an alert from Sentry over Slack, you’ll see additional details like the suggested assignee, the related pull request, and a link to the alert and project that triggered the notification. You can also assign, resolve, or archive the issue all within Slack.
Quality of life: Improved issues accessibility
Embedded Replays
If you are viewing an error event that has an available replay, you previously had to leave the issue details page and open the Replay tab to watch it. Now you can watch your replay alongside all the context within the issue details page. Learn more.
Syntax Highlighting in the Stack Trace
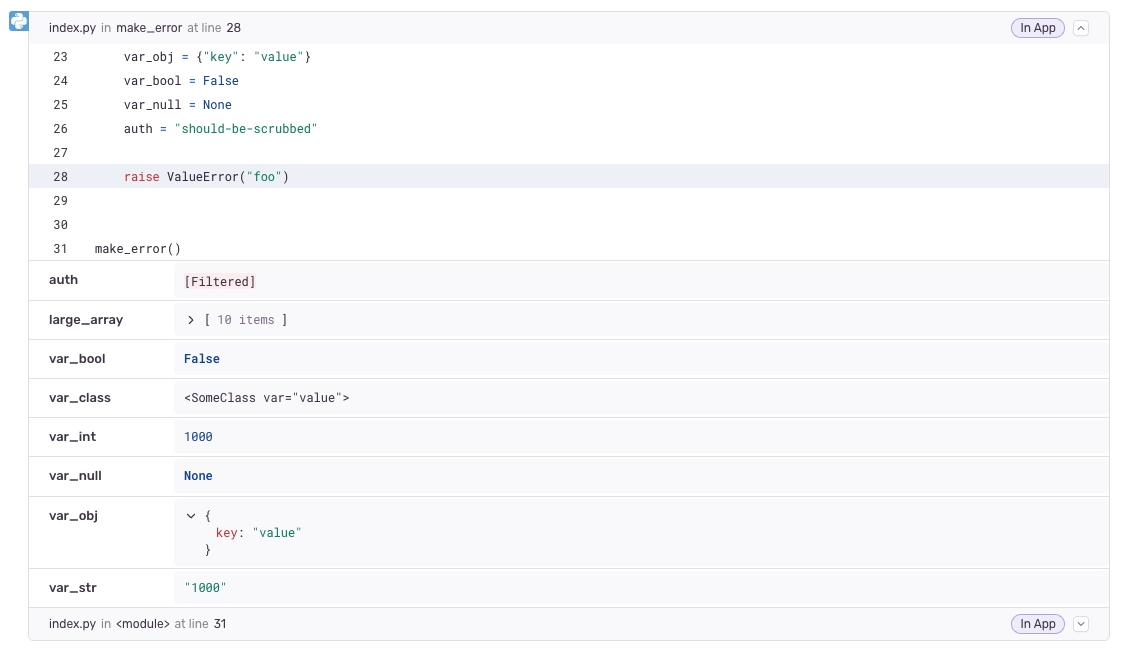
The readability of your code in Sentry just got a big upgrade. Not only does your stack trace incorporate syntax highlighting for all major languages, but we’ve also refreshed how local variables are shown in the stack trace for Python, PHP, Node, and Ruby SDKs. Updates include adding clear data type highlighting, calling out when data is scrubbed due to privacy controls, and displaying boolean and null values according to your language. Learn more.
Unresolved Issue Alerts
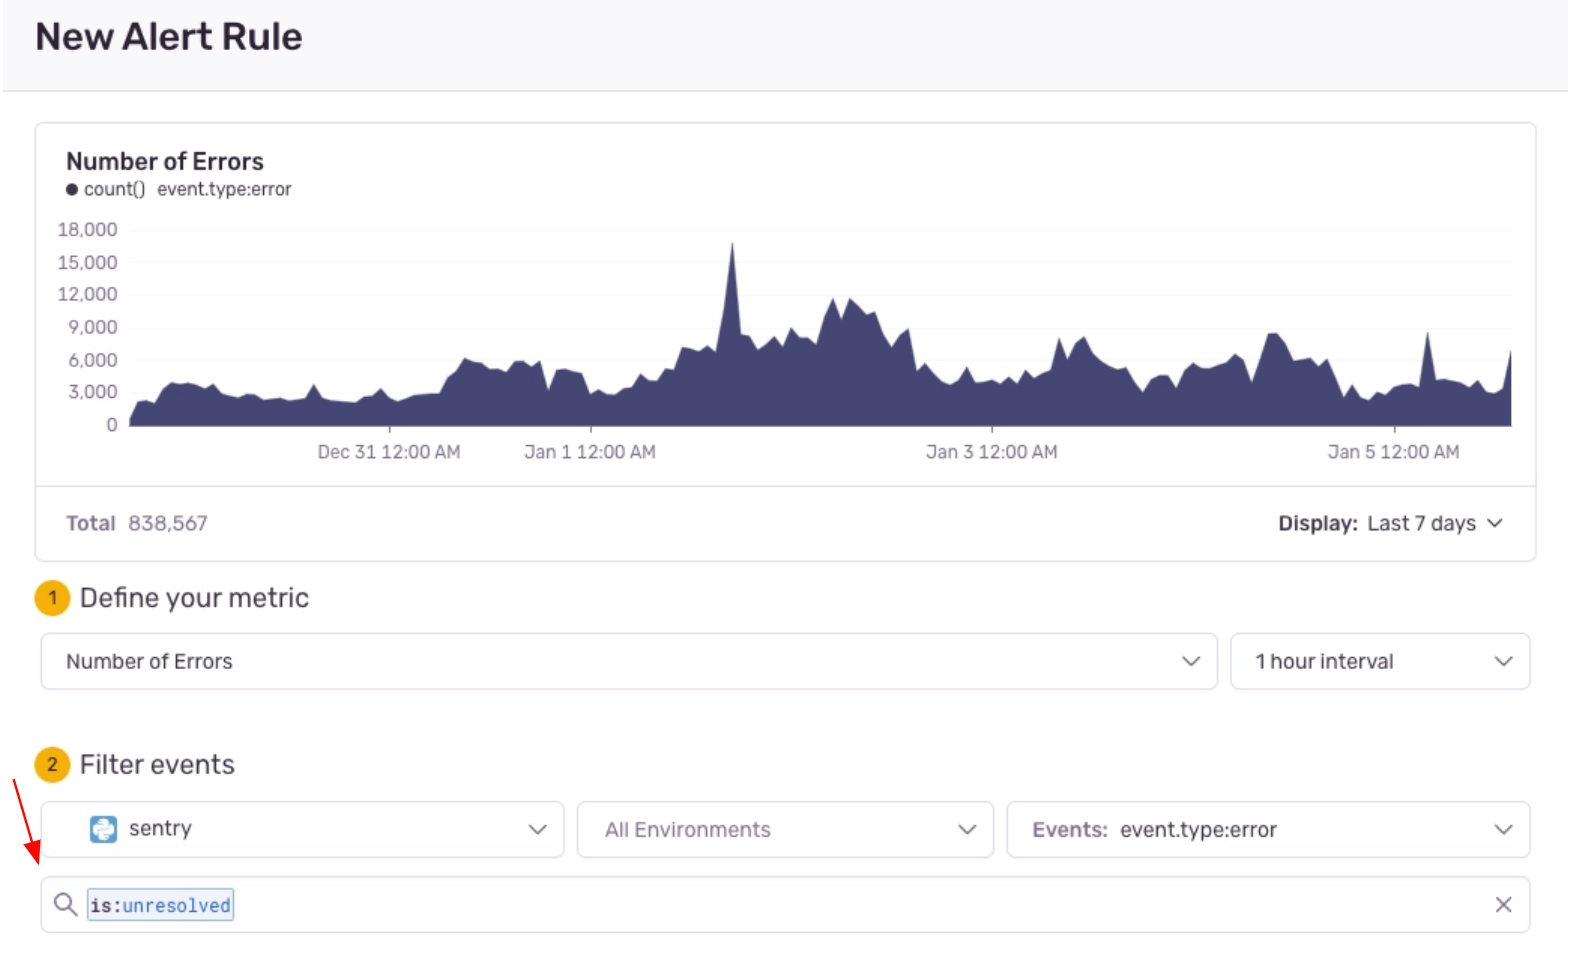
When you receive an alert, chances are you care about unresolved issues, not issues you archived weeks ago. To make your notifications less noisy, when you create a new alert or edit an existing alert, you can filter the notification to only ping you on unresolved issues. Learn more.
Want to stay up-to-date on the latest from Sentry? Check out our changelog for a running list of all product and feature releases. You can also drop us a line on GitHub, Twitter, or Discord. And if you’re new to Sentry, you can try it for free today or request a demo to get started.

