Surfacing Application Errors in Selenium Tests
Surfacing Application Errors in Selenium Tests
Whether a team is one person or one hundred, automated testing uncovers issues in an application before the code is deployed to production. The earlier a problem is diagnosed, the cheaper and less impact it has on you (the developer) and the organization.
If you use continuous integration (CI) like us, automated tests give you a high level of confidence that changes are safe to merge and deploy.
But what about when automated tests fail? In this post, I'll show you how we strengthen our automated tests by surfacing JavaScript errors from Selenium tests in the test report and gaining visibility into exactly what broke in the code and why.
Automated testing: do you have time?
Let's imagine that we've run our automated tests and something failed. At this point, you (the developer) ask the QA engineer what failed. They point you to the test result of the failed test case, which unfortunately only reveals that the test failed due to some assertion. You're provided with a stack trace of the test script/code but left with questions about what happened in the application.
Test:
def test_sampletest(self):
# add two items to cart
self.driver.find_element_by_xpath("(//div[contains(@class,'inventory')]//button)[1]").click()
self.driver.find_element_by_xpath("(//div[contains(@class,'inventory')]//button)[1]").click()
# click on Checkout (this will result in JS/Application error)
self.driver.find_element_by_css_selector(".sidebar button").click()
# assert success message is present/displayed
assert self.driver.find_element_by_class_name("cart-success").is_displayed()Stack trace of failed test:
test.py F
...
# assert success message is present/displayed
>       assert self.driver.find_element_by_class_name("cart-success").is_displayed()
test.py:96:
...
NoSuchElementException: Message: no such element: Unable to locate element: {"method":"class name","selector":"cart-success"}
In an effort to dig deeper, you run the test against your local development server and reproduce the test failure. Once you reproduce, you set up breakpoints in both the test script and the application code that allow you to debug until you figure out what went wrong and where. Then you figure out which developer wrote the code and forward them the issue to fix or roll the code forward.
This process, as you can imagine, takes resources that you can't always spare, and, frequently, you find yourself bouncing between tools or systems to obtain more information on what changed and when.
Surfacing JavaScript errors from Selenium tests
The solution to this resource over-expenditure is to surface JavaScript errors from Selenium tests and show the application error within the test report. To do this, you'll need to set your selenium-session-id as a tag in Sentry within the application under test.
Let’s walk through an example with our artisanal hot dog vendor site, a simple web application. Let’s assume that the application is already using Sentry's JavaScript SDK which was imported via CDN.
Selenium (via javascript injection, i.e., driver.execute_script(...) ) checks to see if Sentry is configured and then sets selenium-session-id as a tag. Errors in this test session will have the selenium-session-id set as a tag when passed to Sentry. We are also setting build-name as a tag, in case we want to figure out how many errors were encountered for the entire build or test suite.
self.session_id = self.driver.session_id

self.driver.execute_script("Sentry && \
    Sentry.configureScope(function (scope) { \
        scope.setTag('selenium-session-id', '%s'); \
        scope.setTag('build-name', '%s'); \
    })" % (self.session_id, os.environ.get('BUILD_TAG')))
At the end of the test (teardown), the test framework checks to see if there were any errors. If errors occurred and were sent to Sentry, you can hit the Sentry /discover REST API (powered by Snuba), passing selenium-session-id as a condition in the payload to obtain relevant errors. You can then display the error information (e.g., stack trace) and link to the errors by outputting them to stdout, which should get picked up by the test result report (e.g., JUnit test report) and read in by CI.
def teardown_method(self, test_method):
    has_errors = self.driver.execute_script("return Sentry.lastEventId()") != None
    self.driver.quit()

    if (has_errors):
        print("\n\n-------- JS Errors (powered by Sentry) --------")

        payload = {
            "orderby": "-time",
            "fields": [
                "id", "issue.id", "message", "error.type", "stack.filename", "stack.abs_path", "stack.lineno",
                "stack.function", "stack.colno"
            ],
            "aggregations": [
                [ "uniq", "id", "uniq_id" ]
            ],
            "range": "14d",
            "conditions": [[ "selenium-session-id", "=", self.session_id]],
            "projects": [ 1356467 ],
            "groupby": [ "time" ]
        }
        headers = {
            'authorization': "Bearer %s" % os.environ.get('SENTRY_AUTH_TOKEN'),
            'content-type': "application/json"
        }
        response = requests.request("POST", "https://sentry.io/api/0/organizations/testorg-az/discover/query/",
                                    data=json.dumps(payload), headers=headers)
        json_data = json.loads(response.text)

        for data in json_data['data']:
            if 'message' in data:
                print("\t%s" % data['message'])

                stack_indexes = range(len(data['stack.function']))
                stack_indexes.reverse()
                for i in stack_indexes:
                    print("\t\tat %s (%s:%s:%s)"
                            % (data['stack.function'][i] or '?', data['stack.filename'][i],
                                data['stack.lineno'][i],
                                data['stack.colno'][i]))
                print(('\tLink to Sentry Issue/Error: '
                        'https://sentry.io/testorg-az/sentry-in-selenium/issues/%s/events/%s/\n' %
                        (data['issue.id'], data['id'])))
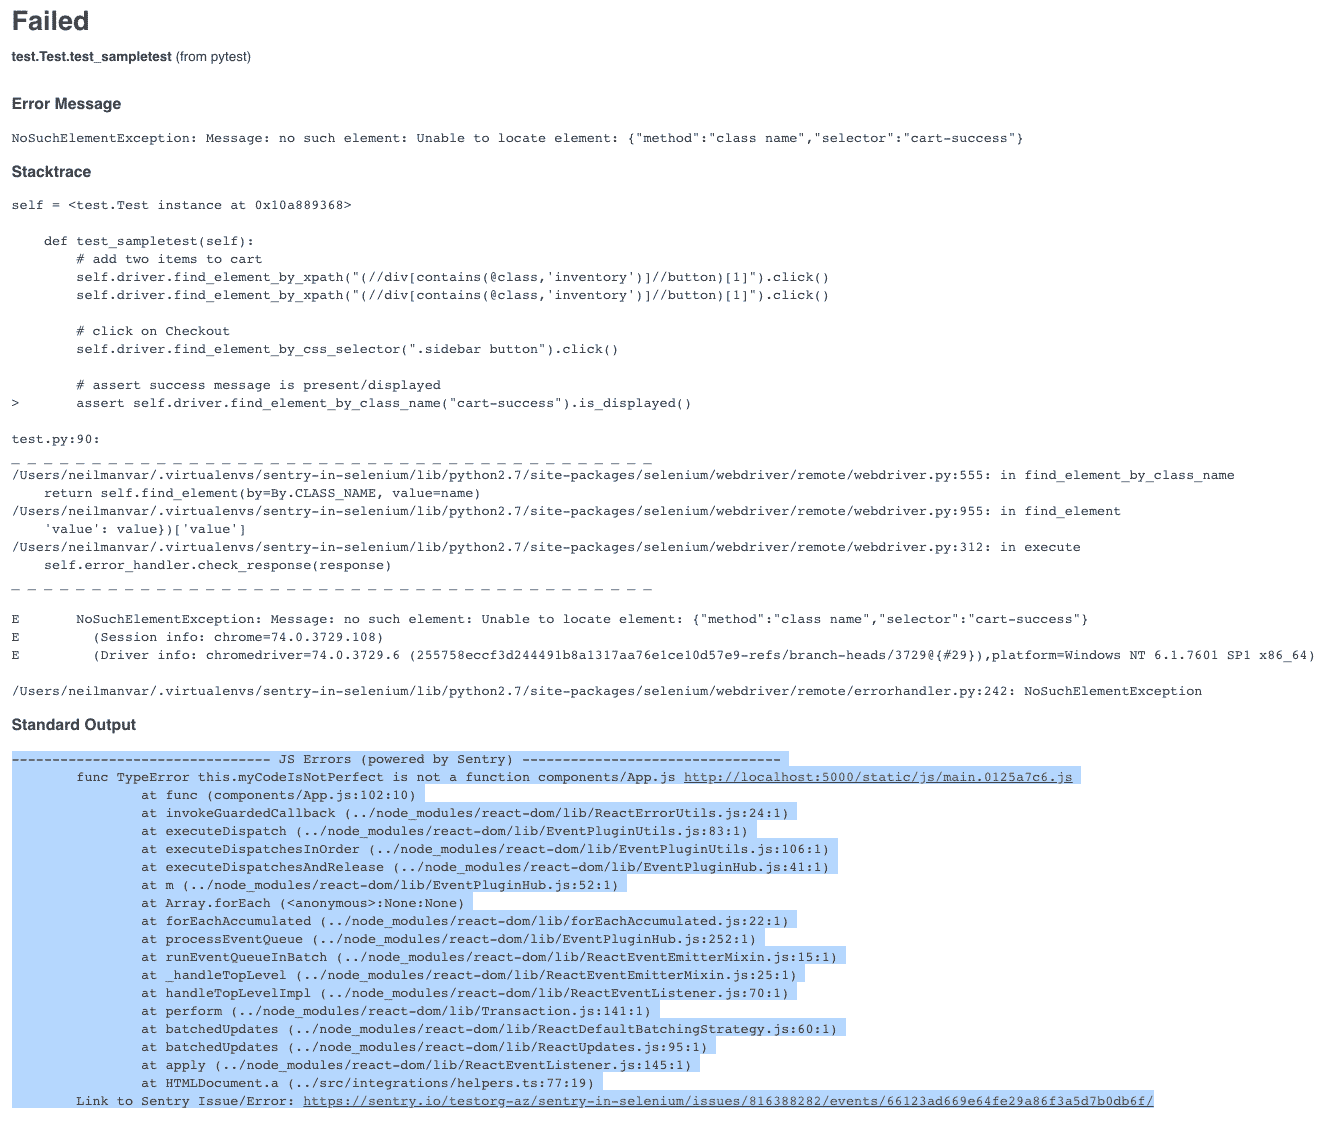
Thanks to Selenium's ability to inject JavaScript (i.e., driver.execute_script(...)), you can interact with Sentry's JavaScript SDK from the Selenium test and then hit Sentry's APIs to obtain the error information if there were application errors in the test.
You'll see the error stack trace in the test result as well as the link to the error in Sentry that can be followed to gain additional context. In Sentry's UI, developers and quality engineers can see when and where the error is happening in the application.
The stack trace obtained from Sentry is the "un-minified" stack trace (thanks to Sentry's source maps functionality), which is actionable and accurate as it points to exactly where in the application code the problem occurred. The engineer can then go to Sentry to find the commit that introduced the error and loop in the engineer who can best debug the issue instead of spending the time and effort to reproduce and eventually debug themselves.
That's it — surfacing JavaScript errors with Selenium tests in the test reports gives you the visibility you need to uncover exactly what broke in your code. With this application error data, you could even gate builds and block deployment if new JavaScript errors are introduced or the total number of errors spike so that application errors are addressed and remediated before they reach production and affect actual users.
Now, it's your turn. Go tweak the setup and teardown methods in your testing framework and use the techniques above to surface application errors.
You can also see our complete project and code here.


