Tame the performance of code you didn't write: A journey into stable diffusion
Tame the performance of code you didn't write: A journey into stable diffusionIn our daily lives as developers, we have to deal with a lot of code that we did not write ourselves (or wrote ourselves but already forgot that we did). We use tons of libraries that make our lives easier because they deal with complex stuff like machine learning, time zones, or printing. As a result, much of the code base we work with on a daily basis is a black box to us.
But there are times when we need to learn what is happening in that black box. And so, we boldly go where no other team member has gone before! Let me show you my journey from when I tried to figure out what is happening in Stable Diffusion (you know, this thing that can generate pictures from any text prompt you give it.)
Stable Diffusion is written in Python, my favorite programming language. Other than that, I knew very little about deep learning or neural networks. So Stable Diffusion was the perfect black box for me to explore.
Getting Sentry working with Stable Diffusion
First I cloned the Stable Diffusion web UI to my machine and set it up like described on the web.
I created a new project on Sentry.io. Then I added the Sentry SDK to the Stable Diffusion web UI and enabled traces and profiles. I put this into txt2img.py because I guessed that was the entry point of the image generation from text prompts:
# file: txt2img.py
import sentry_sdk
sentry_sdk.init(
dsn="<my-dsn>",
traces_sample_rate=1.0,
_experiments={
"profiles_sample_rate": 1.0,
},
)There is a function called txt2img() in the Stable Diffusion web UI code that I just guessed did all the magic.
In this function, I created a Sentry transaction spanning the whole content of the txt2img() function. This was necessary for all the performance data to show up in Sentry.io:
# file: txt2img.py

def txt2img(id_task: str, prompt: str,... , *args):
    with sentry_sdk.start_transaction(op="function", name="txt2img"): # 👈 this is the line I added
        # all the normal `txt2img` code.
I then started web UI and let Stable Diffusion create an image. After a few moments I had:
a picture of an Astronaut riding a horse
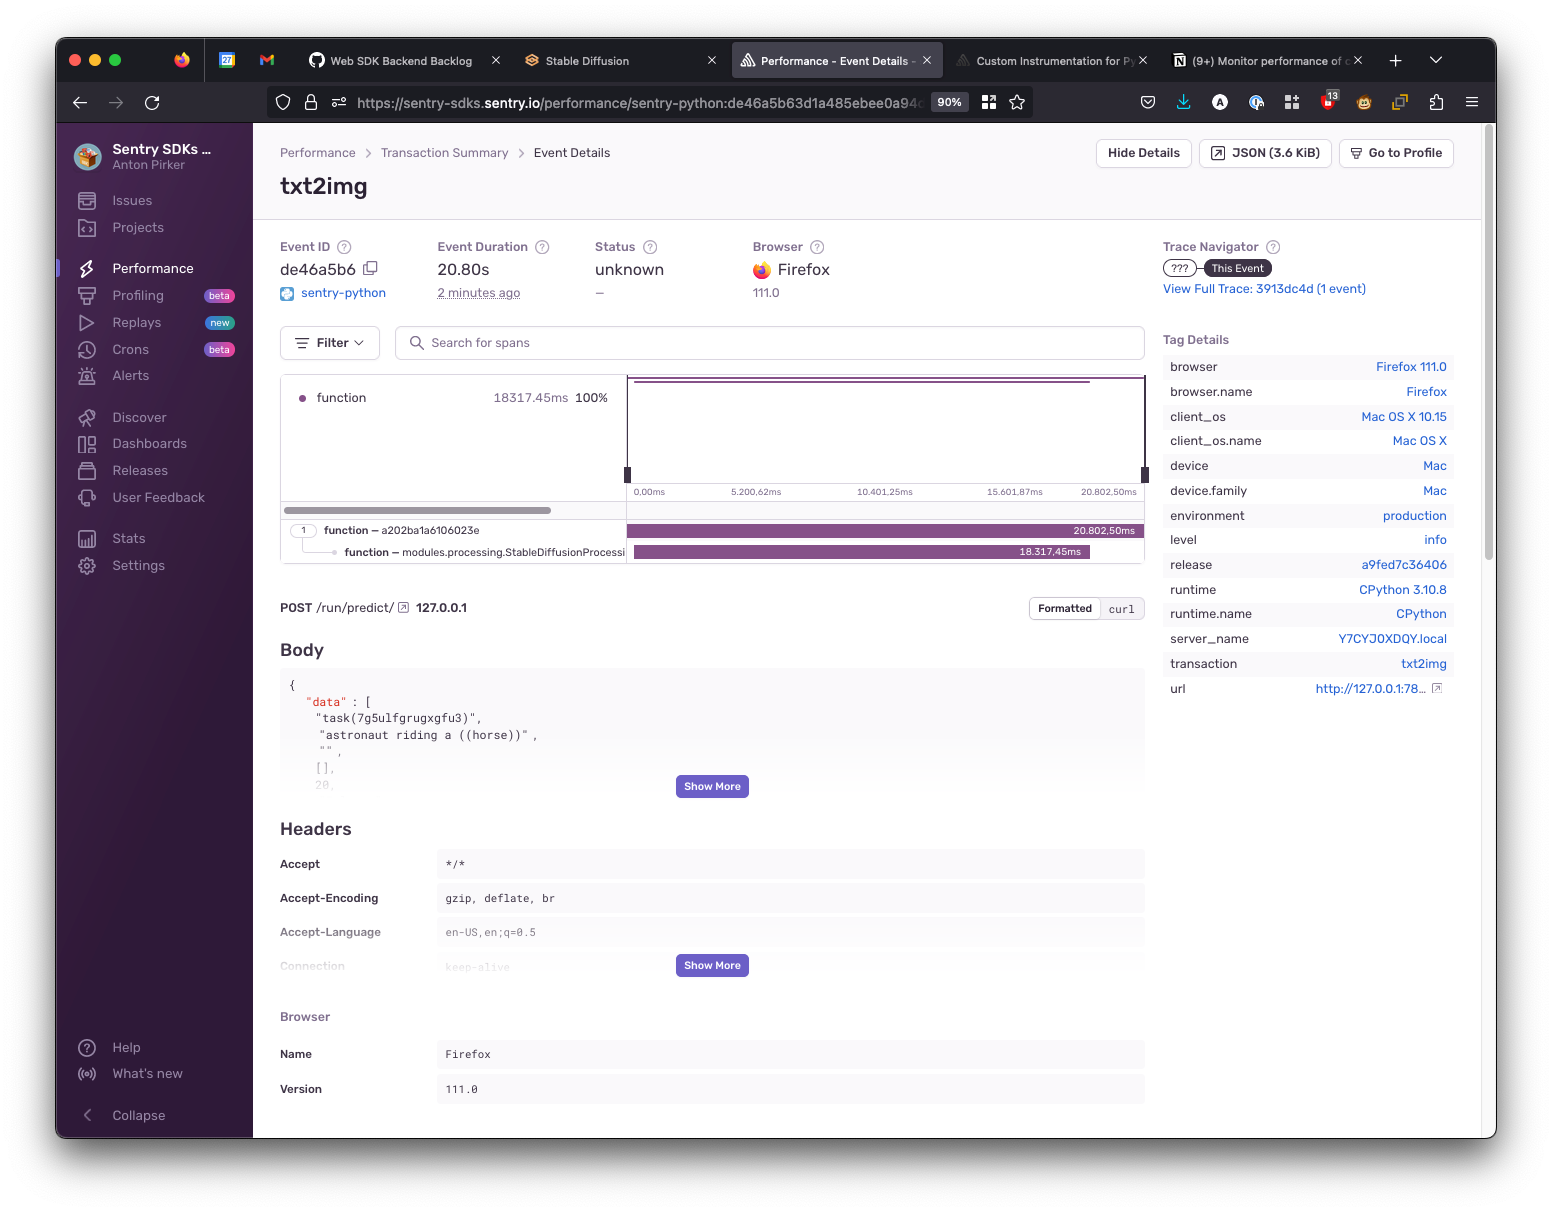
and my new transaction showing up in Sentry.io under “Performance”:
Using Profiling flame graphs to see code execution
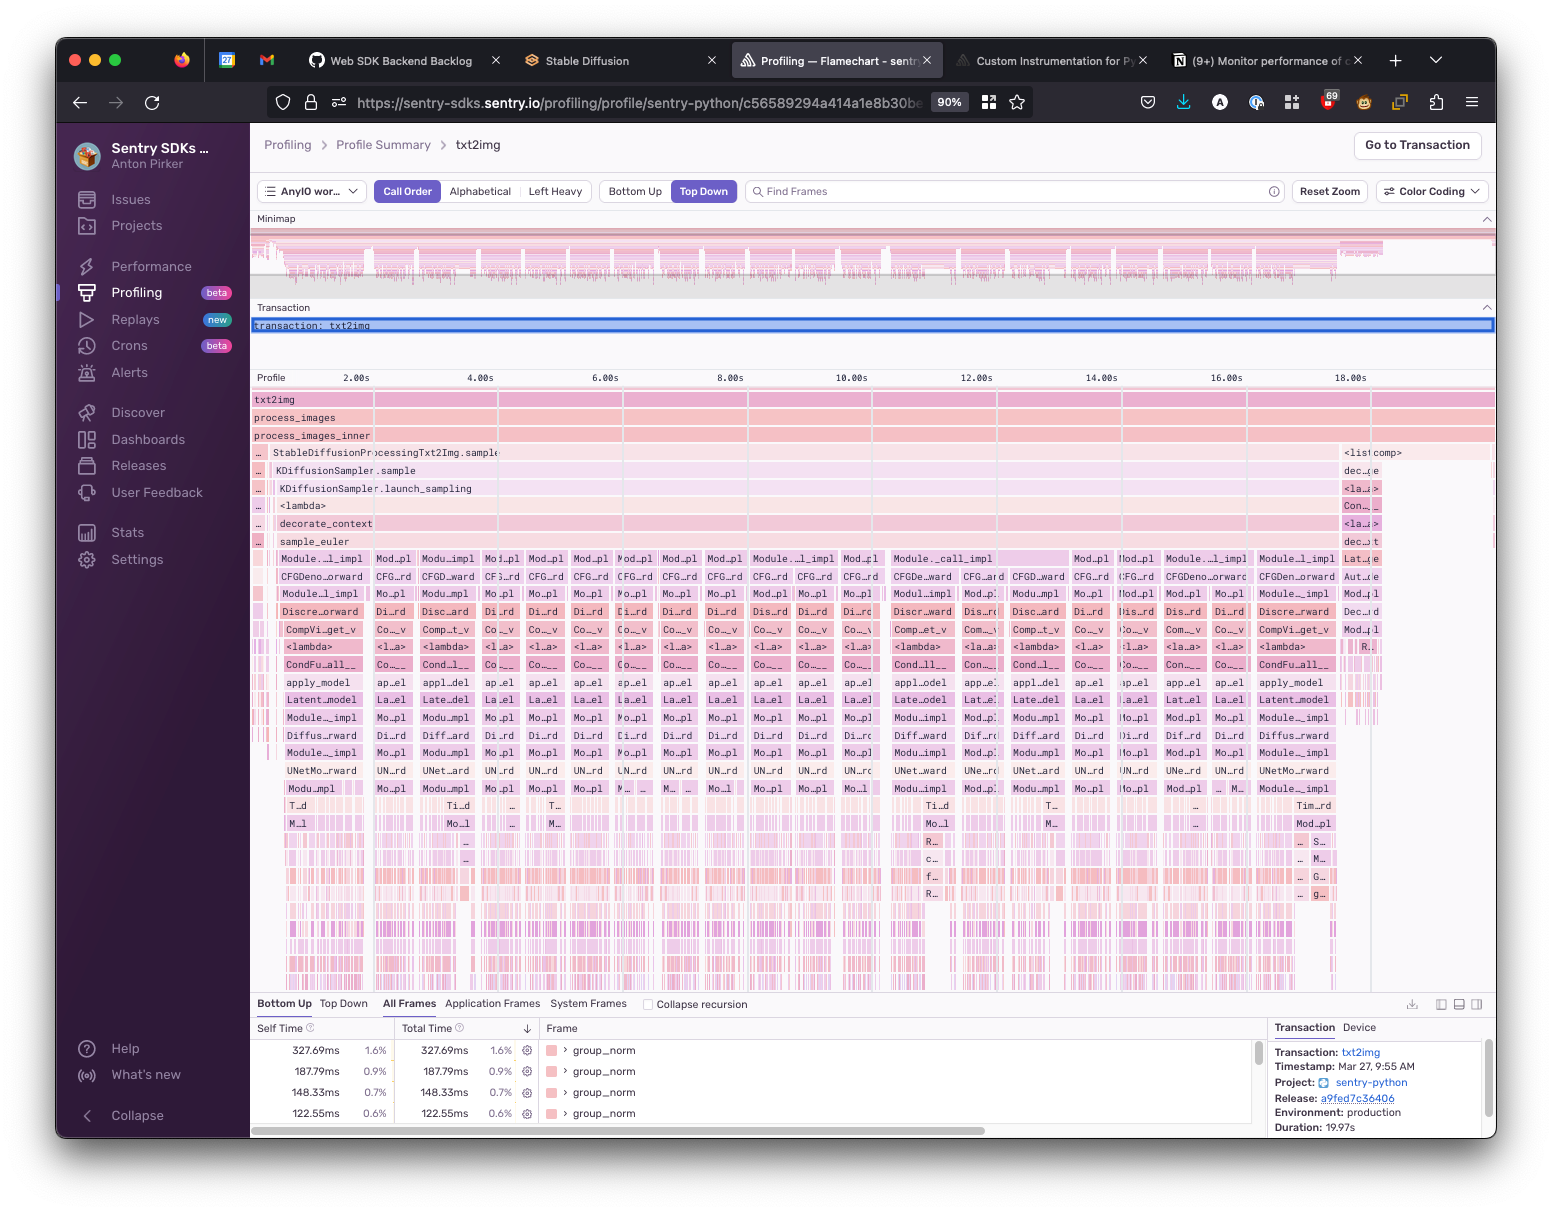
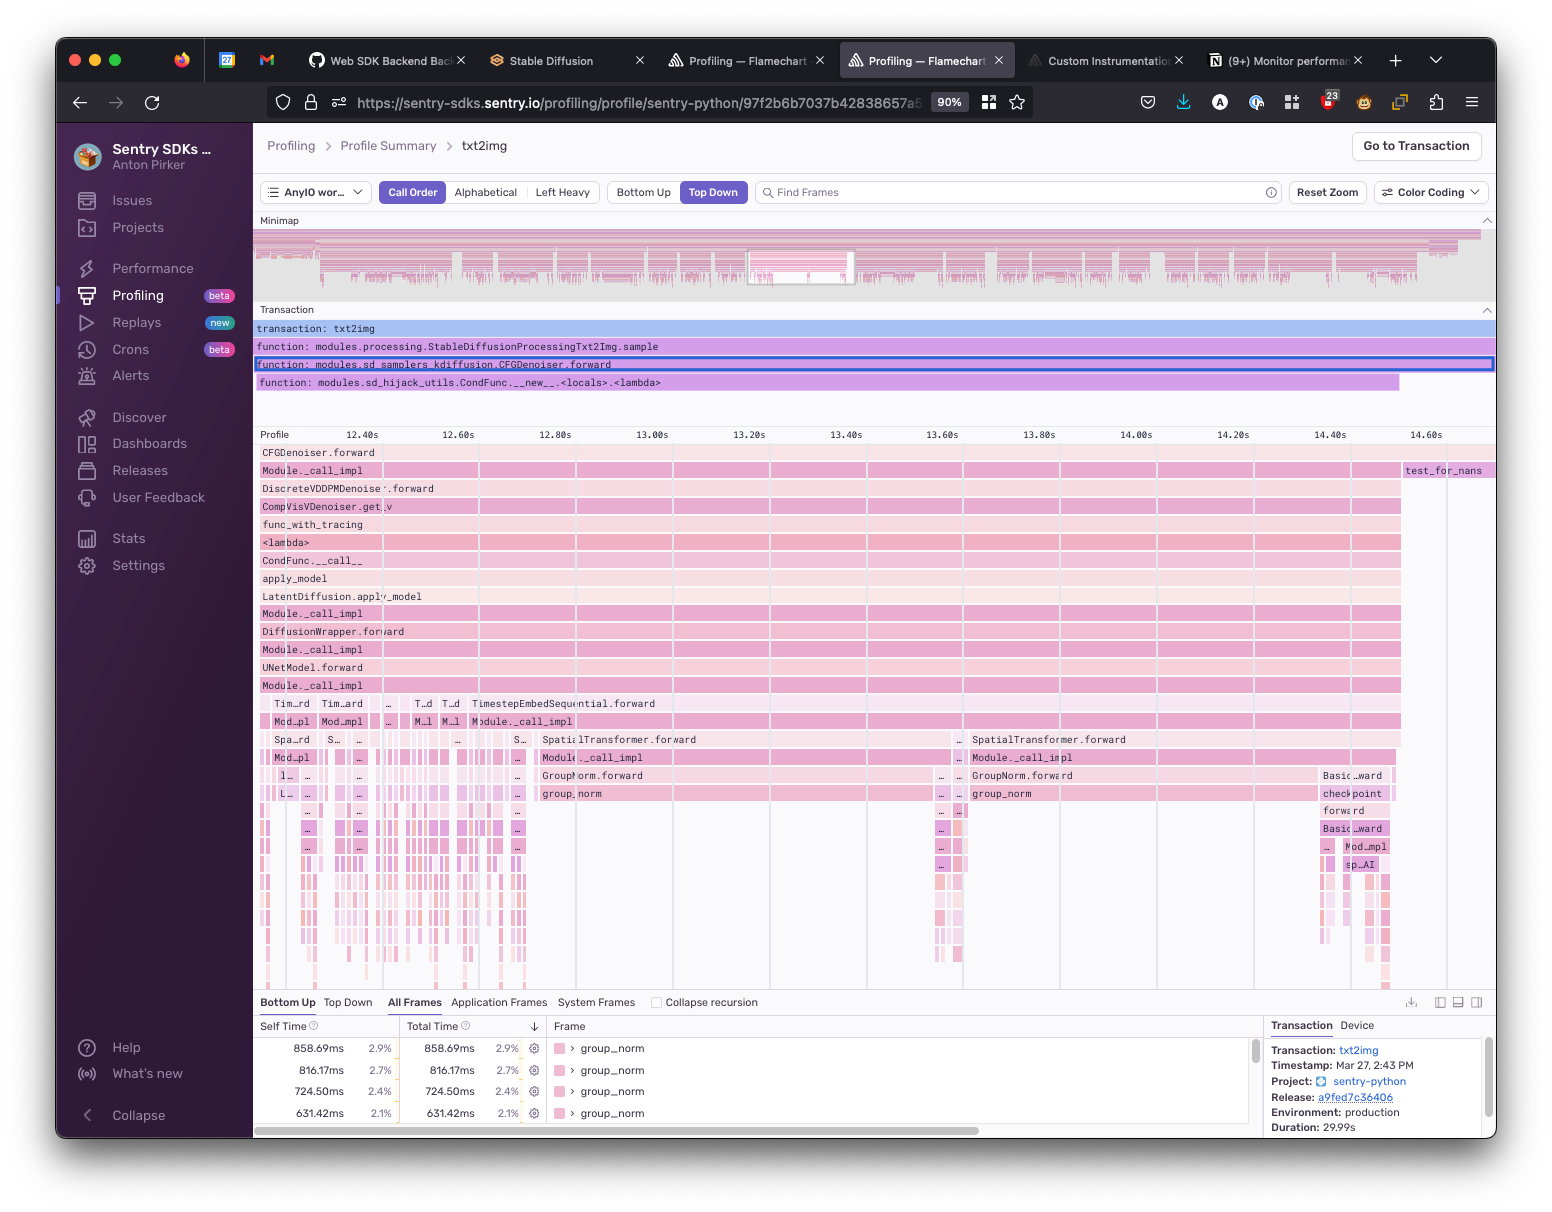
The purple bar represents your code execution. By itself it may not have been that exciting, but paired with Profiling, I was able to glean some insights. I opened the Profiling flame graph to see the code execution like this:
We now see a detailed flame graph of all the functions executed:
(Profiling flame graphs can be quite intimidating if you're not used to reading them. Check out these docs on how to make sense of them.)
From the flame graph, I could see that it took significant time to execute in the StableDiffusionProcessingTxt2Img.sample function — so I decided to add it to my instrumentation.
Using functions_to_trace to monitor performance for specific functions
functions_to_trace to monitor performance for specific functionsThe parameter functions_to_trace (introduced in Sentry Python SDK 1.18.0) allowed me to give fully qualified function names to the Sentry SDK, and those functions were then performance-instrumented and the results were attached to the transaction we created earlier.
I changed my code to look like this:
# file: txt2img.py
import sentry_sdk

functions_to_trace = [
    { "qualified_name": "modules.processing.StableDiffusionProcessingTxt2Img.sample" },
]
sentry_sdk.init(
    dsn="<my-dsn>",
    traces_sample_rate=1.0,
		functions_to_trace=functions_to_trace,
    _experiments={
        "profiles_sample_rate": 1.0,
    },
)
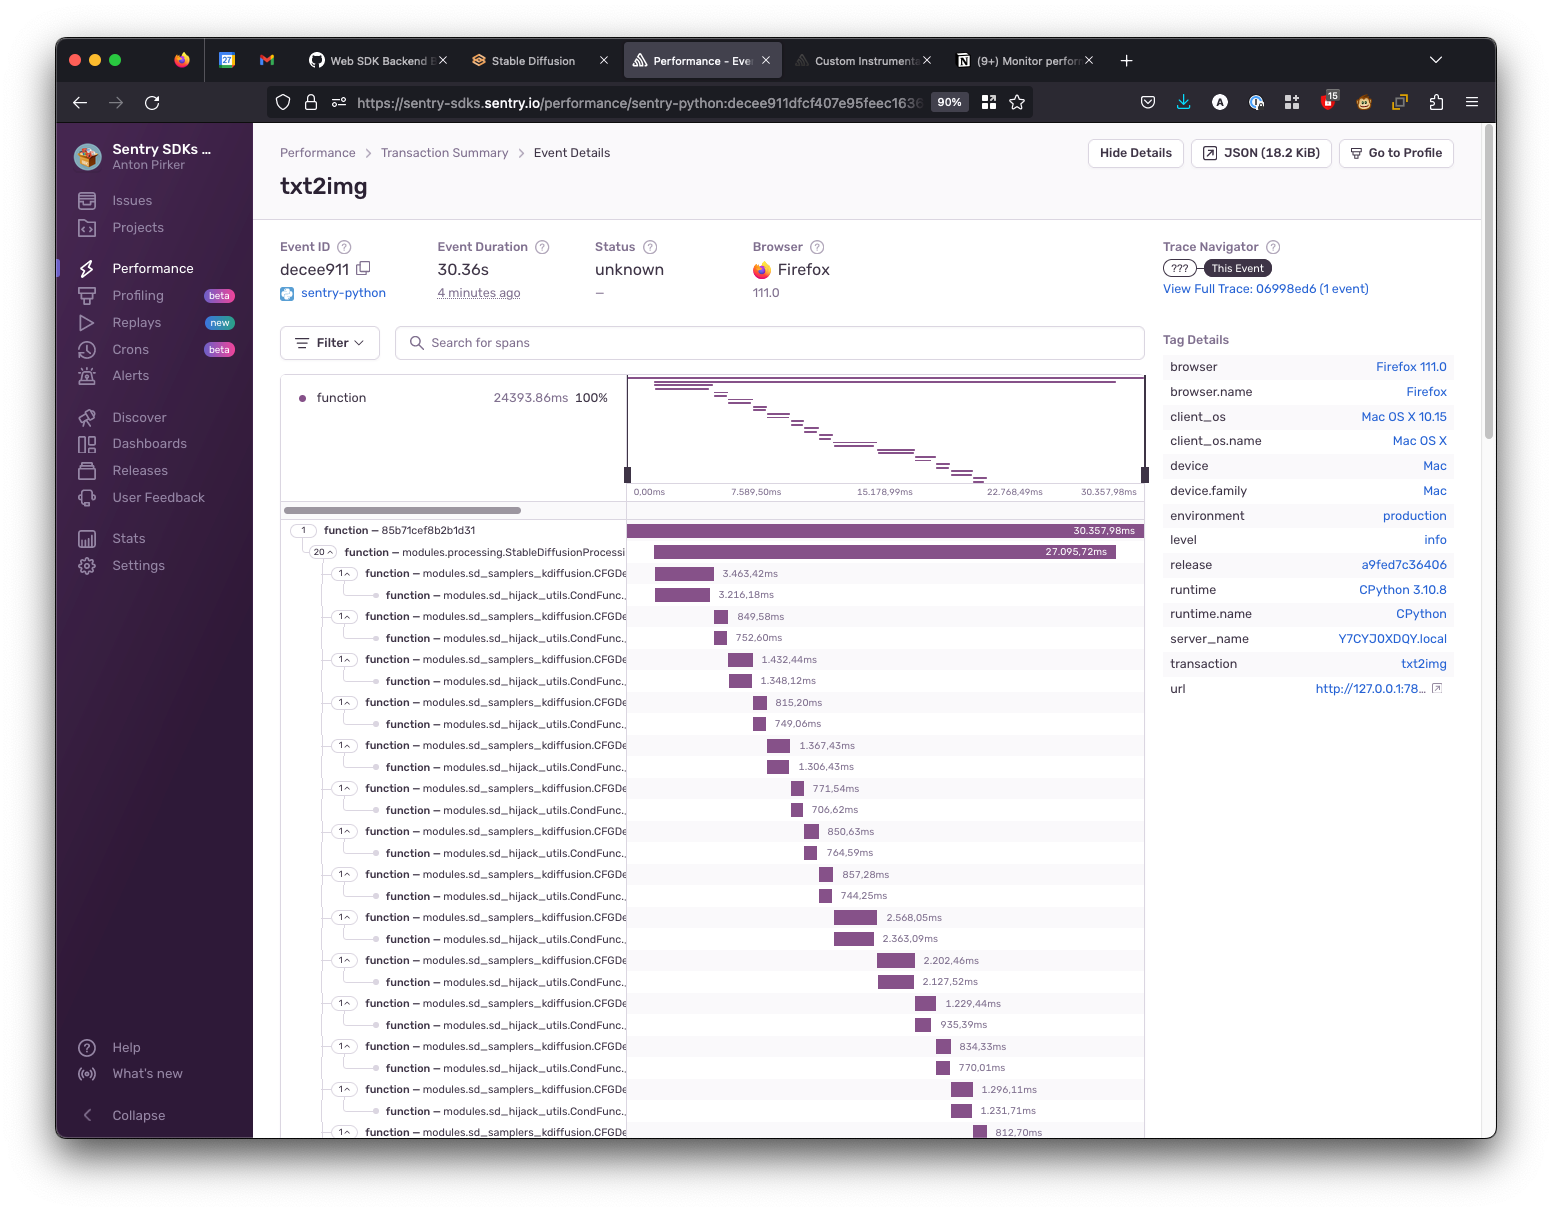
After restarting the Stable Diffusion web UI and letting it generate another painting, the resulting performance diagram looked like this:
To improve my waterfall diagram, I repeated the following process a couple of times:
Found interesting or important looking function calls in the flame graph (these function calls are wide and/or called repeatedly).
Added the function to my
functions_to_tracelist.Generated a new image to have the function in my waterfall diagram.
Looked at the profile of that function trace to drill further down into the bottleneck.
Soon my setup looked like this:
functions_to_trace = [
    { "qualified_name": "modules.processing.StableDiffusionProcessingTxt2Img.sample" },
    { "qualified_name": "modules.sd_samplers_kdiffusion.CFGDenoiser.forward" },
    { "qualified_name": "ldm.models.diffusion.ddpm.LatentDiffusion.apply_model" },
]

sentry_sdk.init(
    dsn="<my-dsn>",
    traces_sample_rate=1.0,
		functions_to_trace=functions_to_trace,
    _experiments={
        "profiles_sample_rate": 1.0,
    },
)
Following that process resulted in a performance waterfall diagram like this:
We see that there is a loop that calls our two instrumented functions a bunch of times. Sometimes the execution is fast (700-800ms) and sometimes it can take up to 2.5 seconds.
Using Profiling flame graphs to discover performance issues
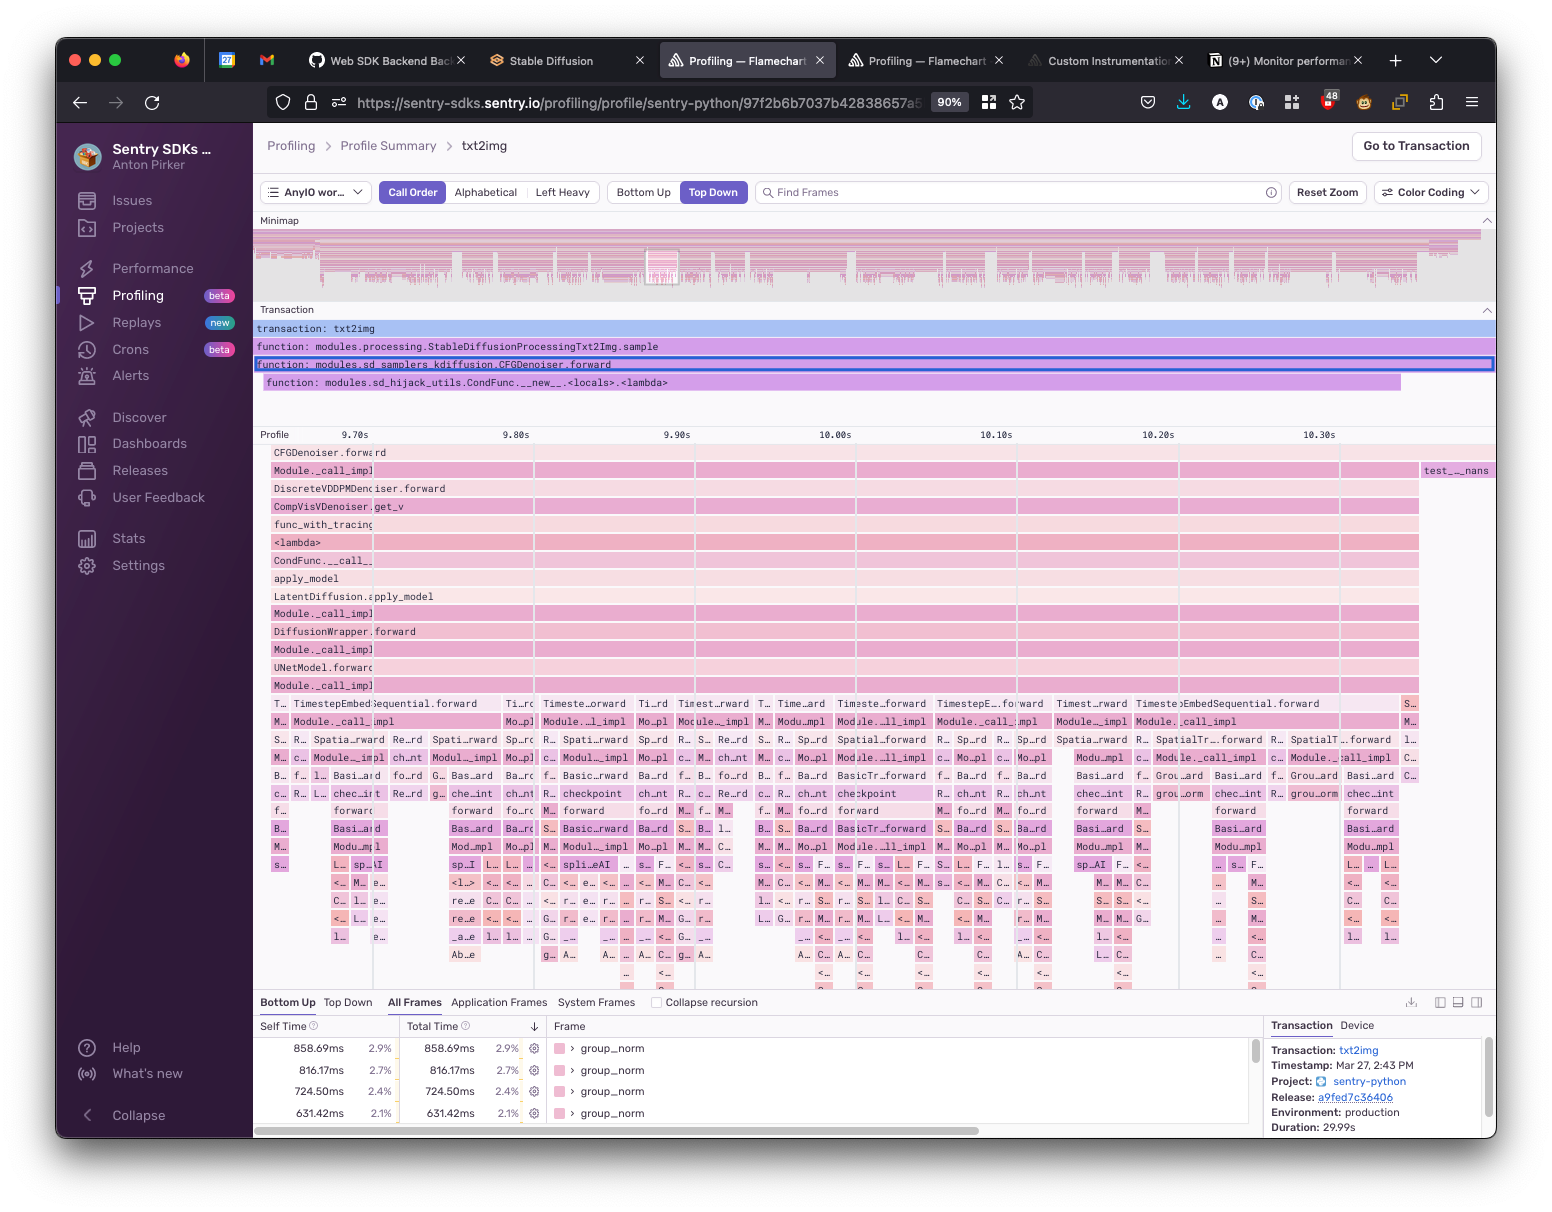
To check why it was taking way longer in certain situations, I compared the Profiling flame graph of a slow and the fast execution.
First, I looked at the profile of a “fast” execution:
Then I also looked at the profile of a “slow” execution:
We immediately see that there is a function group_norm (a group normalization function in PyTorch) taking a lot of resources to execute (as seen via its bar, which is very wide). While digging into why this is slow and how to improve this is outside of the scope of this blog post (and my knowledge of PyTorch or Stable Diffusion), I loved that I went from total black box to identifying an area where we can probably improve our performance in a matter of one or two hours. This process felt really powerful, and I even nabbed flame graphs (from Profiling) as part of my tool belt.
Conclusion
I wanted to show you how you can take a big code base and transform it from being a black box into something that you maybe do not fully understand, but can at least reason about. This is a very powerful skill, as it lets you see things that other developers can not see. And doing this with just a few simple reproducible steps and without touching the code you want understand:
Wrap the main Loop or a major function in a Sentry transaction
Look at the Profiling flame graph to find long-running functions
Add those long-running functions to the list of functions to instrument
Repeat until you have a good granularity of in your performance waterfall diagram
Now you have “a big picture” view of what your code is doing in the performance waterfall diagram and can drill all the way down to the system level in your Profiling flame graphs.
Have fun exploring the unknown territories of your code base! Godspeed!
Learn more about Profiling and see it in action with a demo from our engineering team.
If you're new to Profiling as a concept, you can also check out this blog series for more on what Profiling is and why it can help you solve performance bottlenecks.
You can also find us on GitHub, Twitter, or Discord. And if you’re new to Sentry, you can try it for free today or request a demo to get started.


