The New Way of React Native Debugging
The New Way of React Native Debugging
This is a guest post from Simon Grimm, creator of Galaxies.dev, where Simon helps developers learn React Native through fast-paced courses and personal support.
Debugging React Native apps has traditionally been a bit of a pain. Developers usually ranked debugging as their biggest pain point of React Native, which, as we all know, makes up quite a lot of development time.
But the good news is that things are getting better.
The debugging landscape for React Native has changed a lot over the last few years. Expo has been working on a new set of plugins that make debugging a lot easier, Flipper was deprecated, and the React Native team has been working on a new set of DevTools that are a big improvement over the old ones.
And while the new React Native DevTools are great, there are still some gaps that need to be filled.
In this tutorial, we'll explore the different tools available for debugging React Native apps, and how they can be used together to create a comprehensive debugging strategy.
We will go all the way from JavaScript to native code, so you know exactly what's going on in your app, and you are able to trace down every error.
The new React Native DevTools are great
That's what the new React Native DevTools are all about - aligning with the web dev experience.
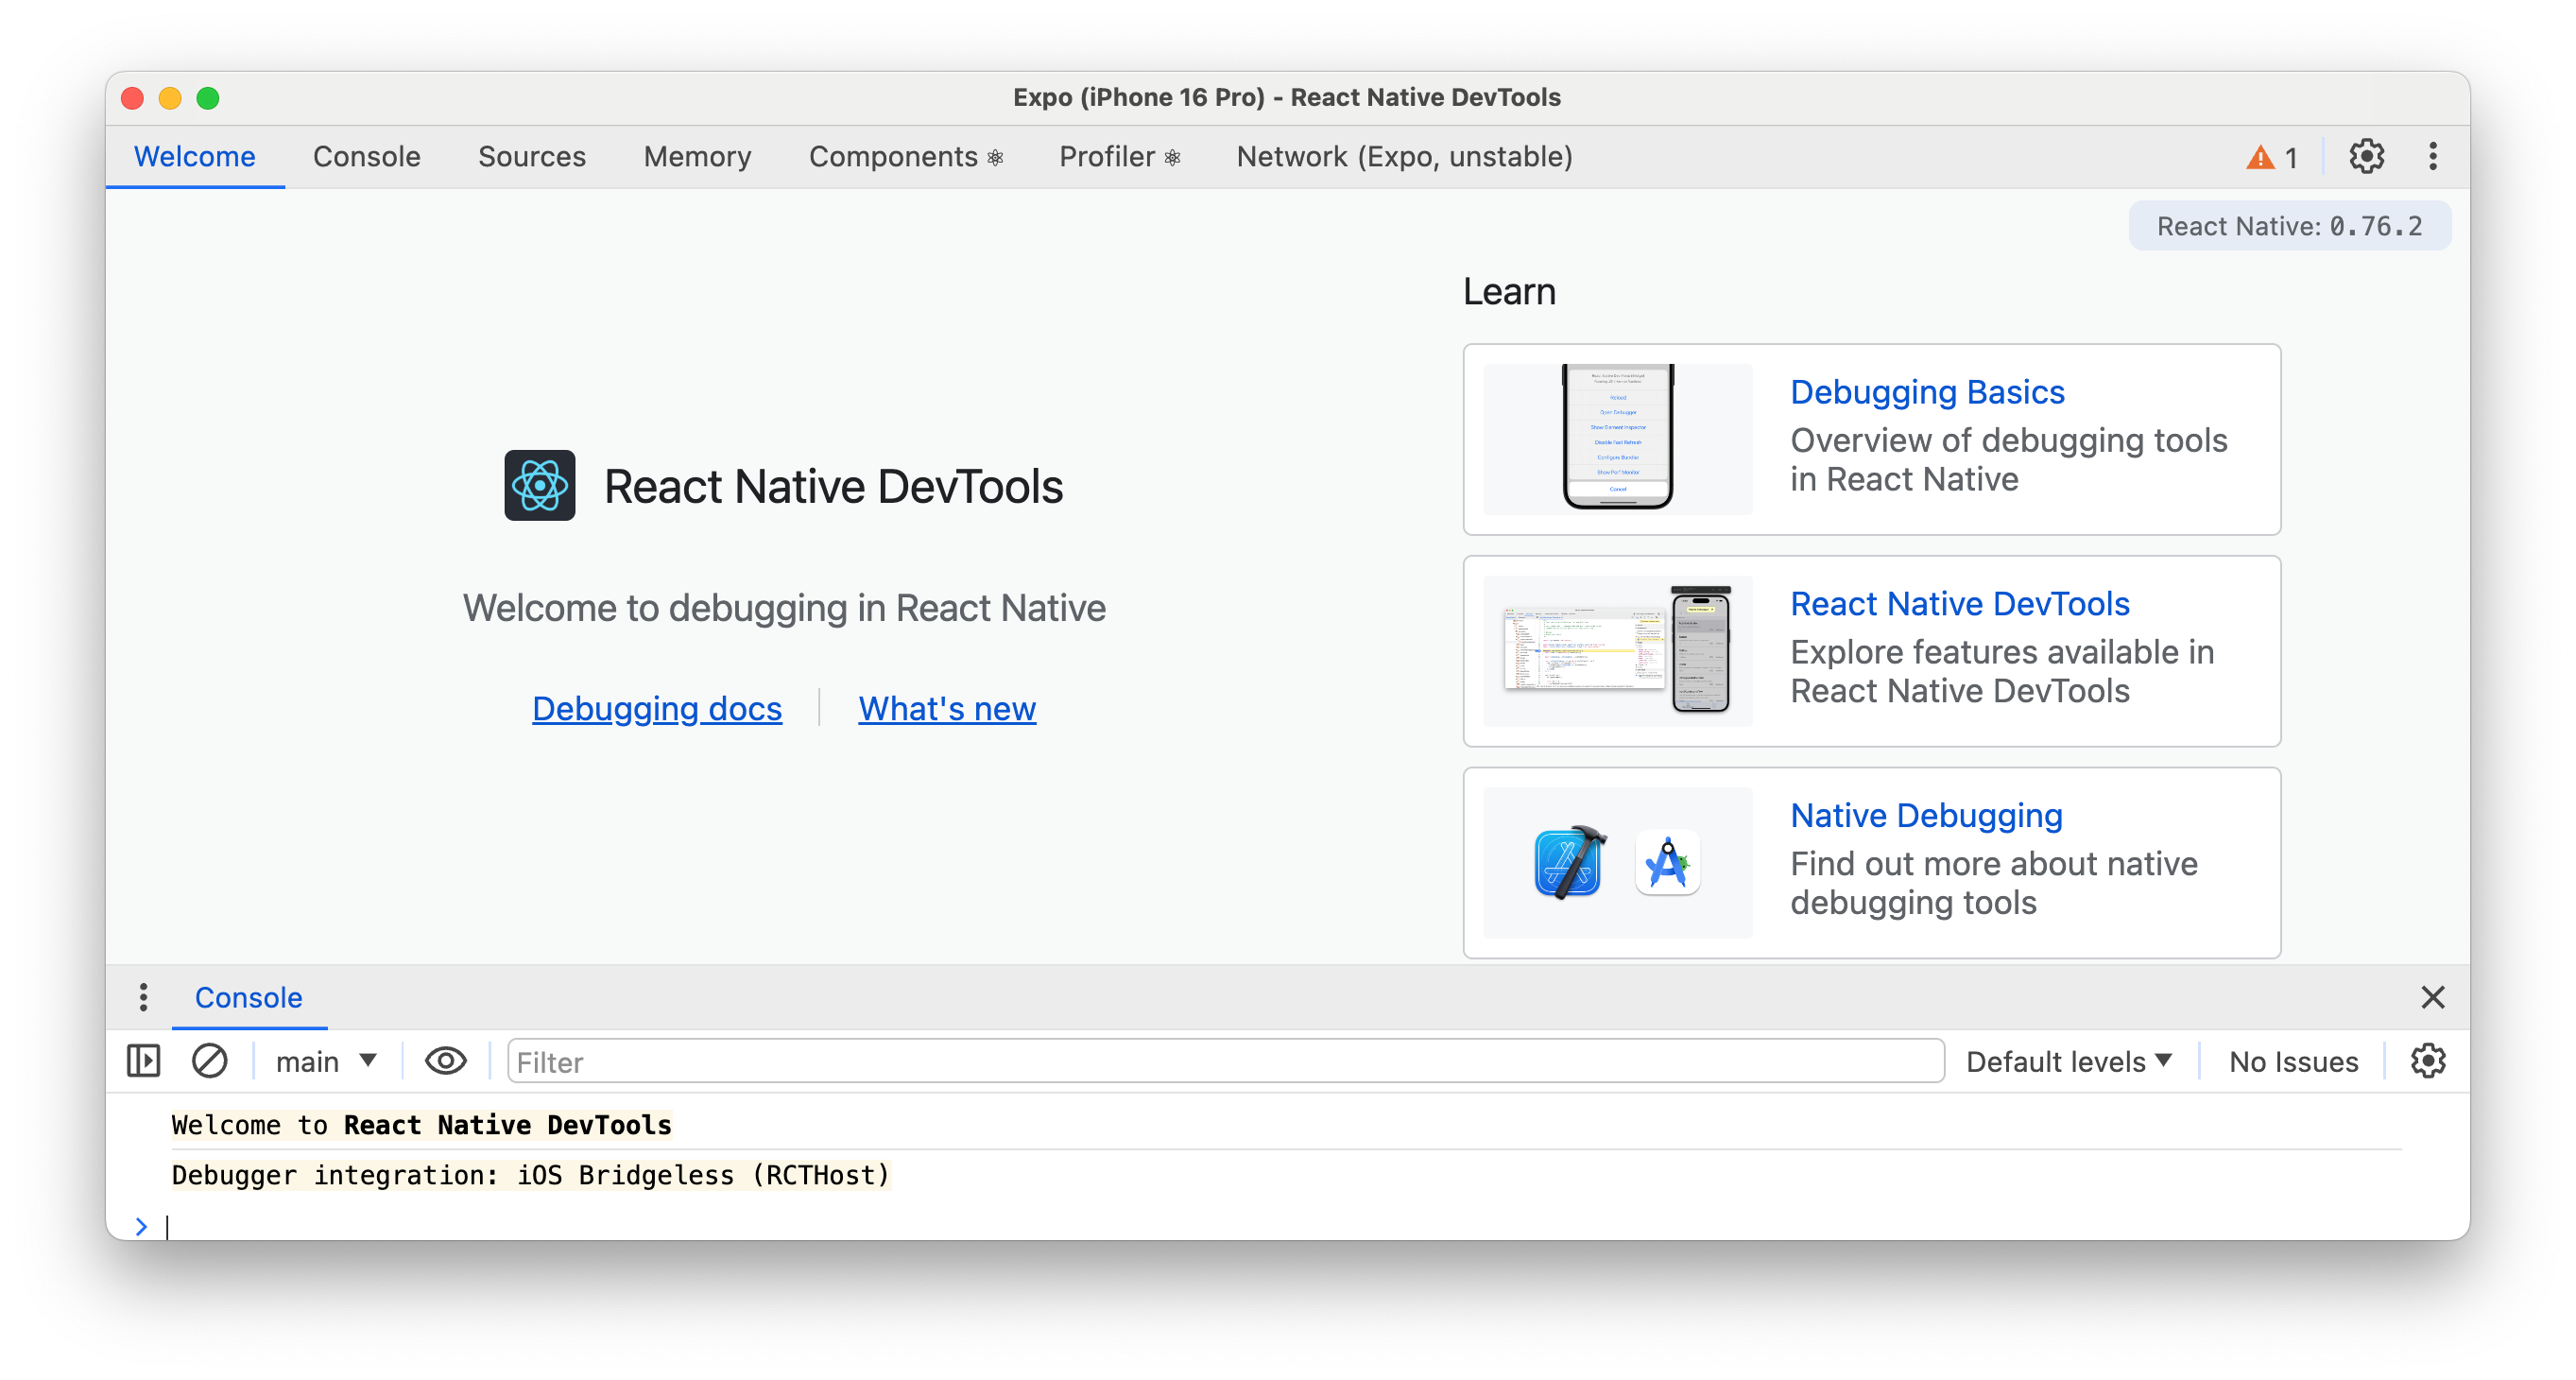
You can open the DevTools by running (in Expo projects) and then pressing j in the terminal.
This will bring up a somewhat familiar view:
The main features are:
Logs: View and filter logs from your app.
Source & Breakpoints: Debug your JavaScript code.
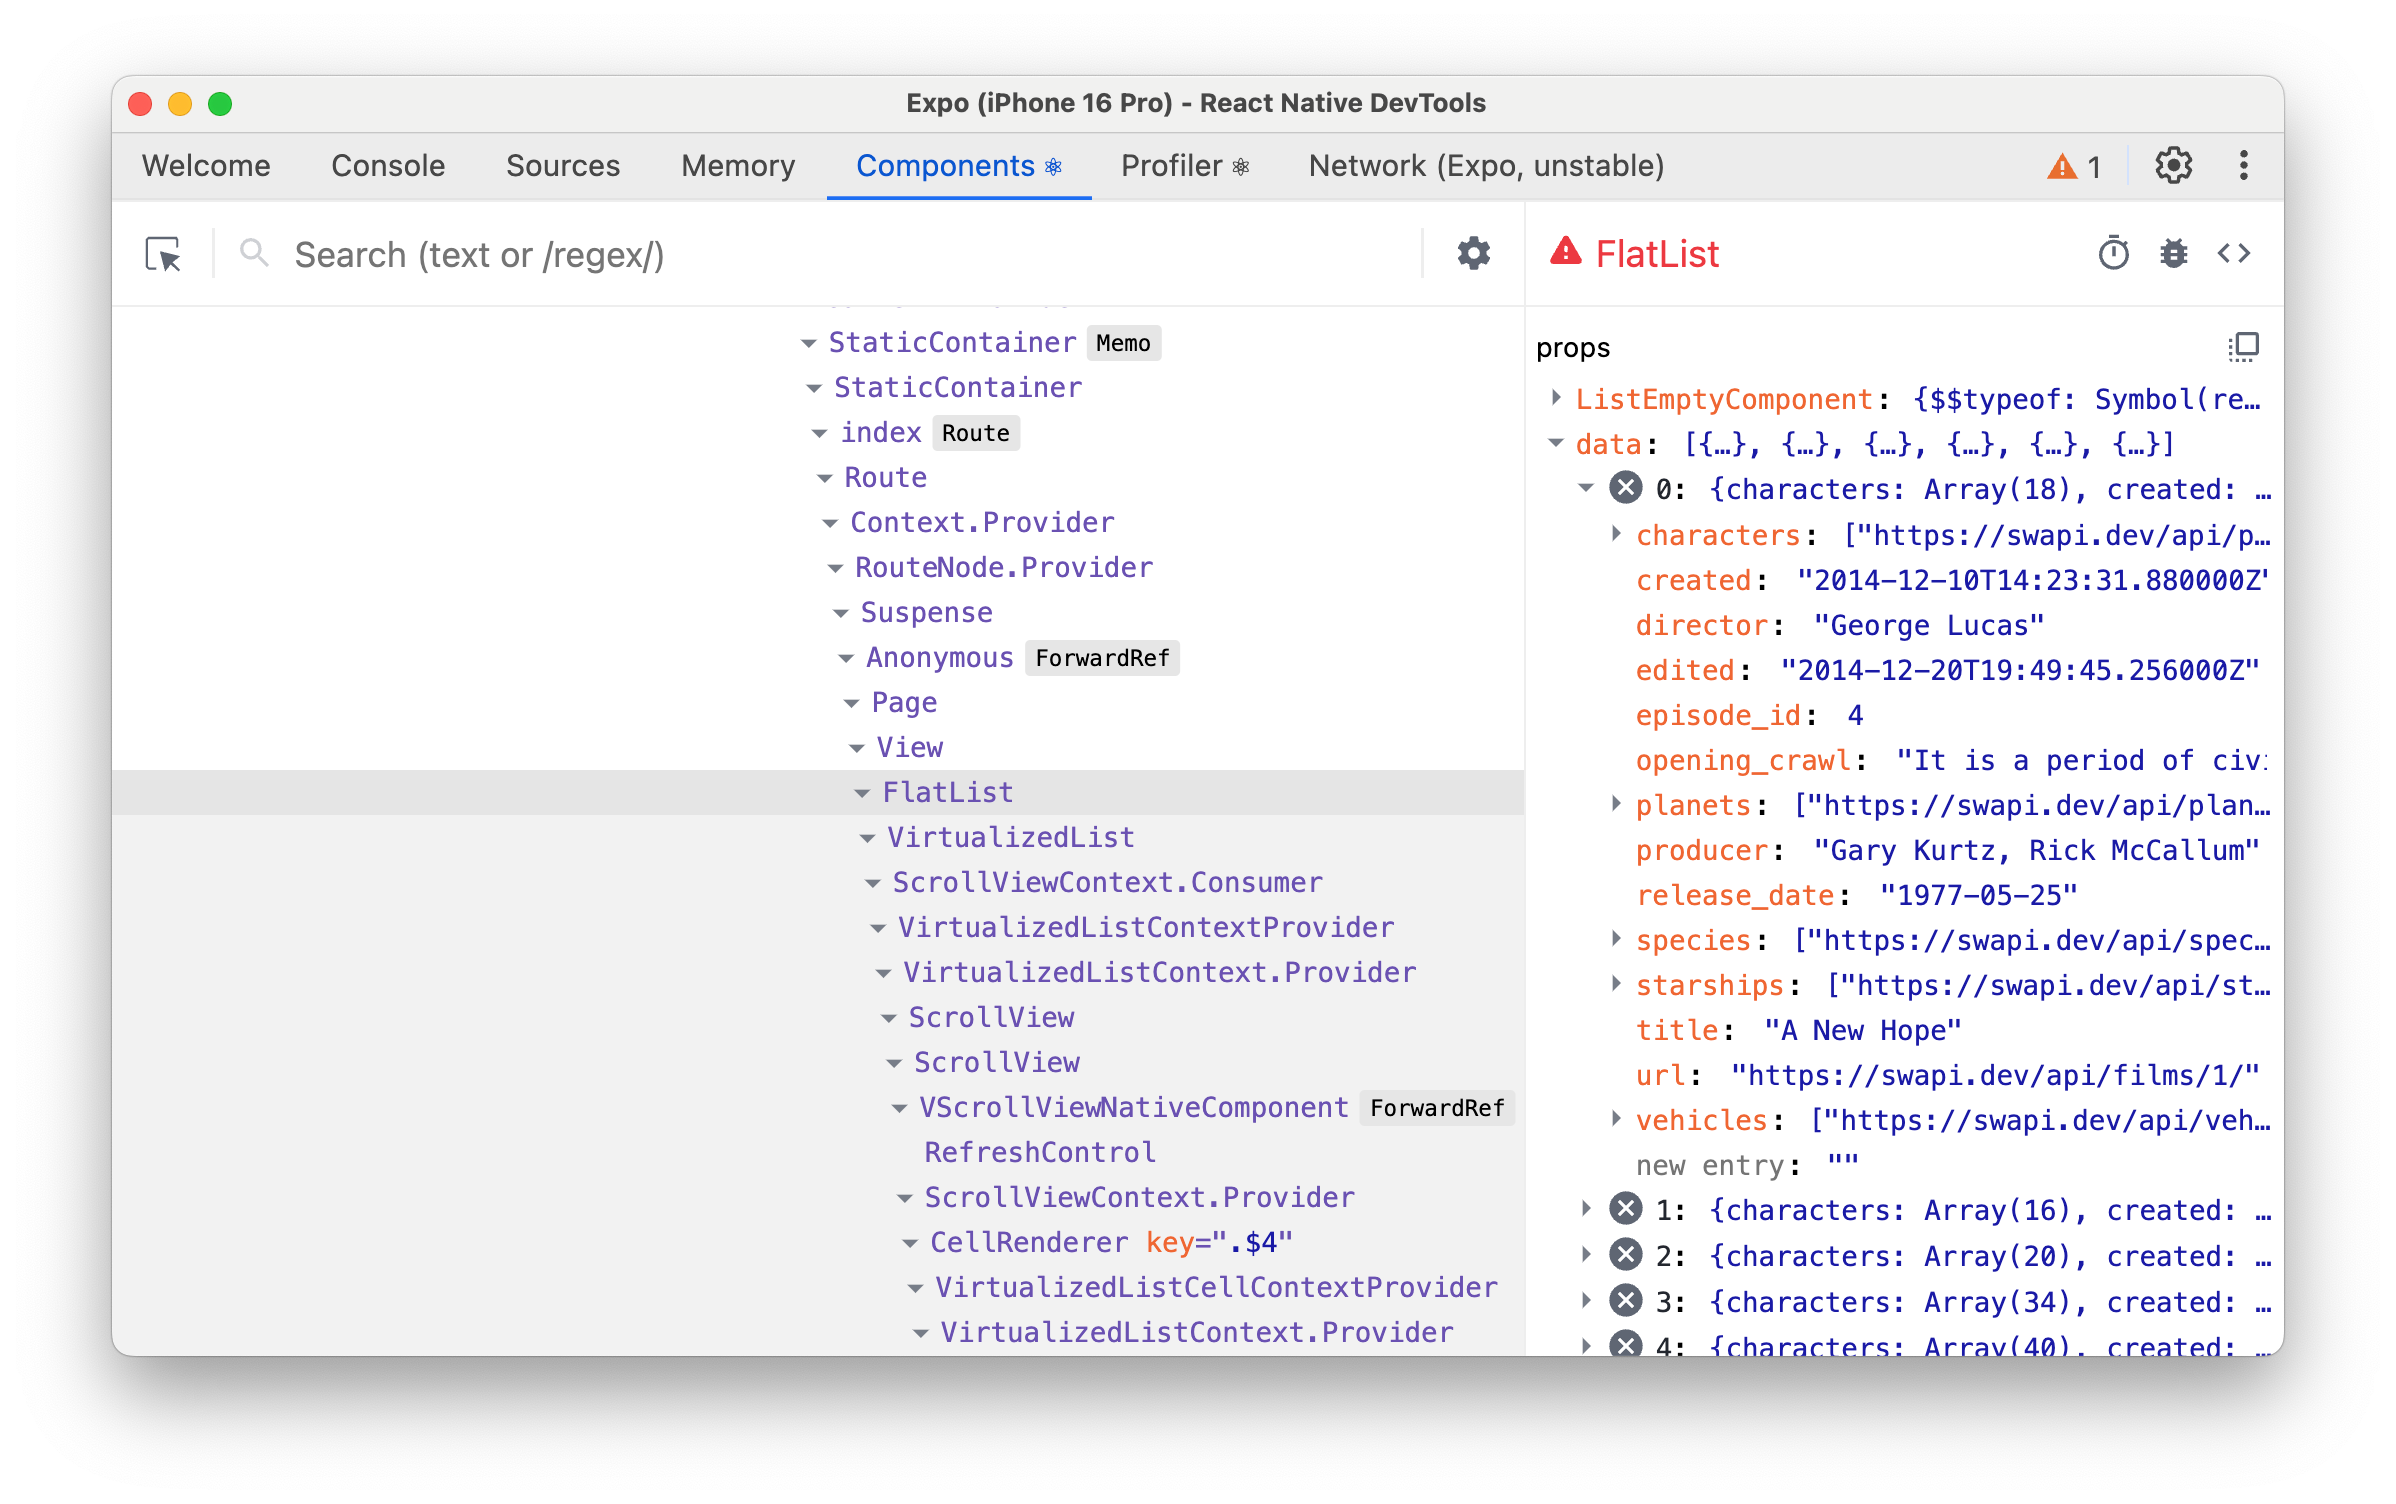
Components Explorer: Visualize your component hierarchy and inspect props and state.
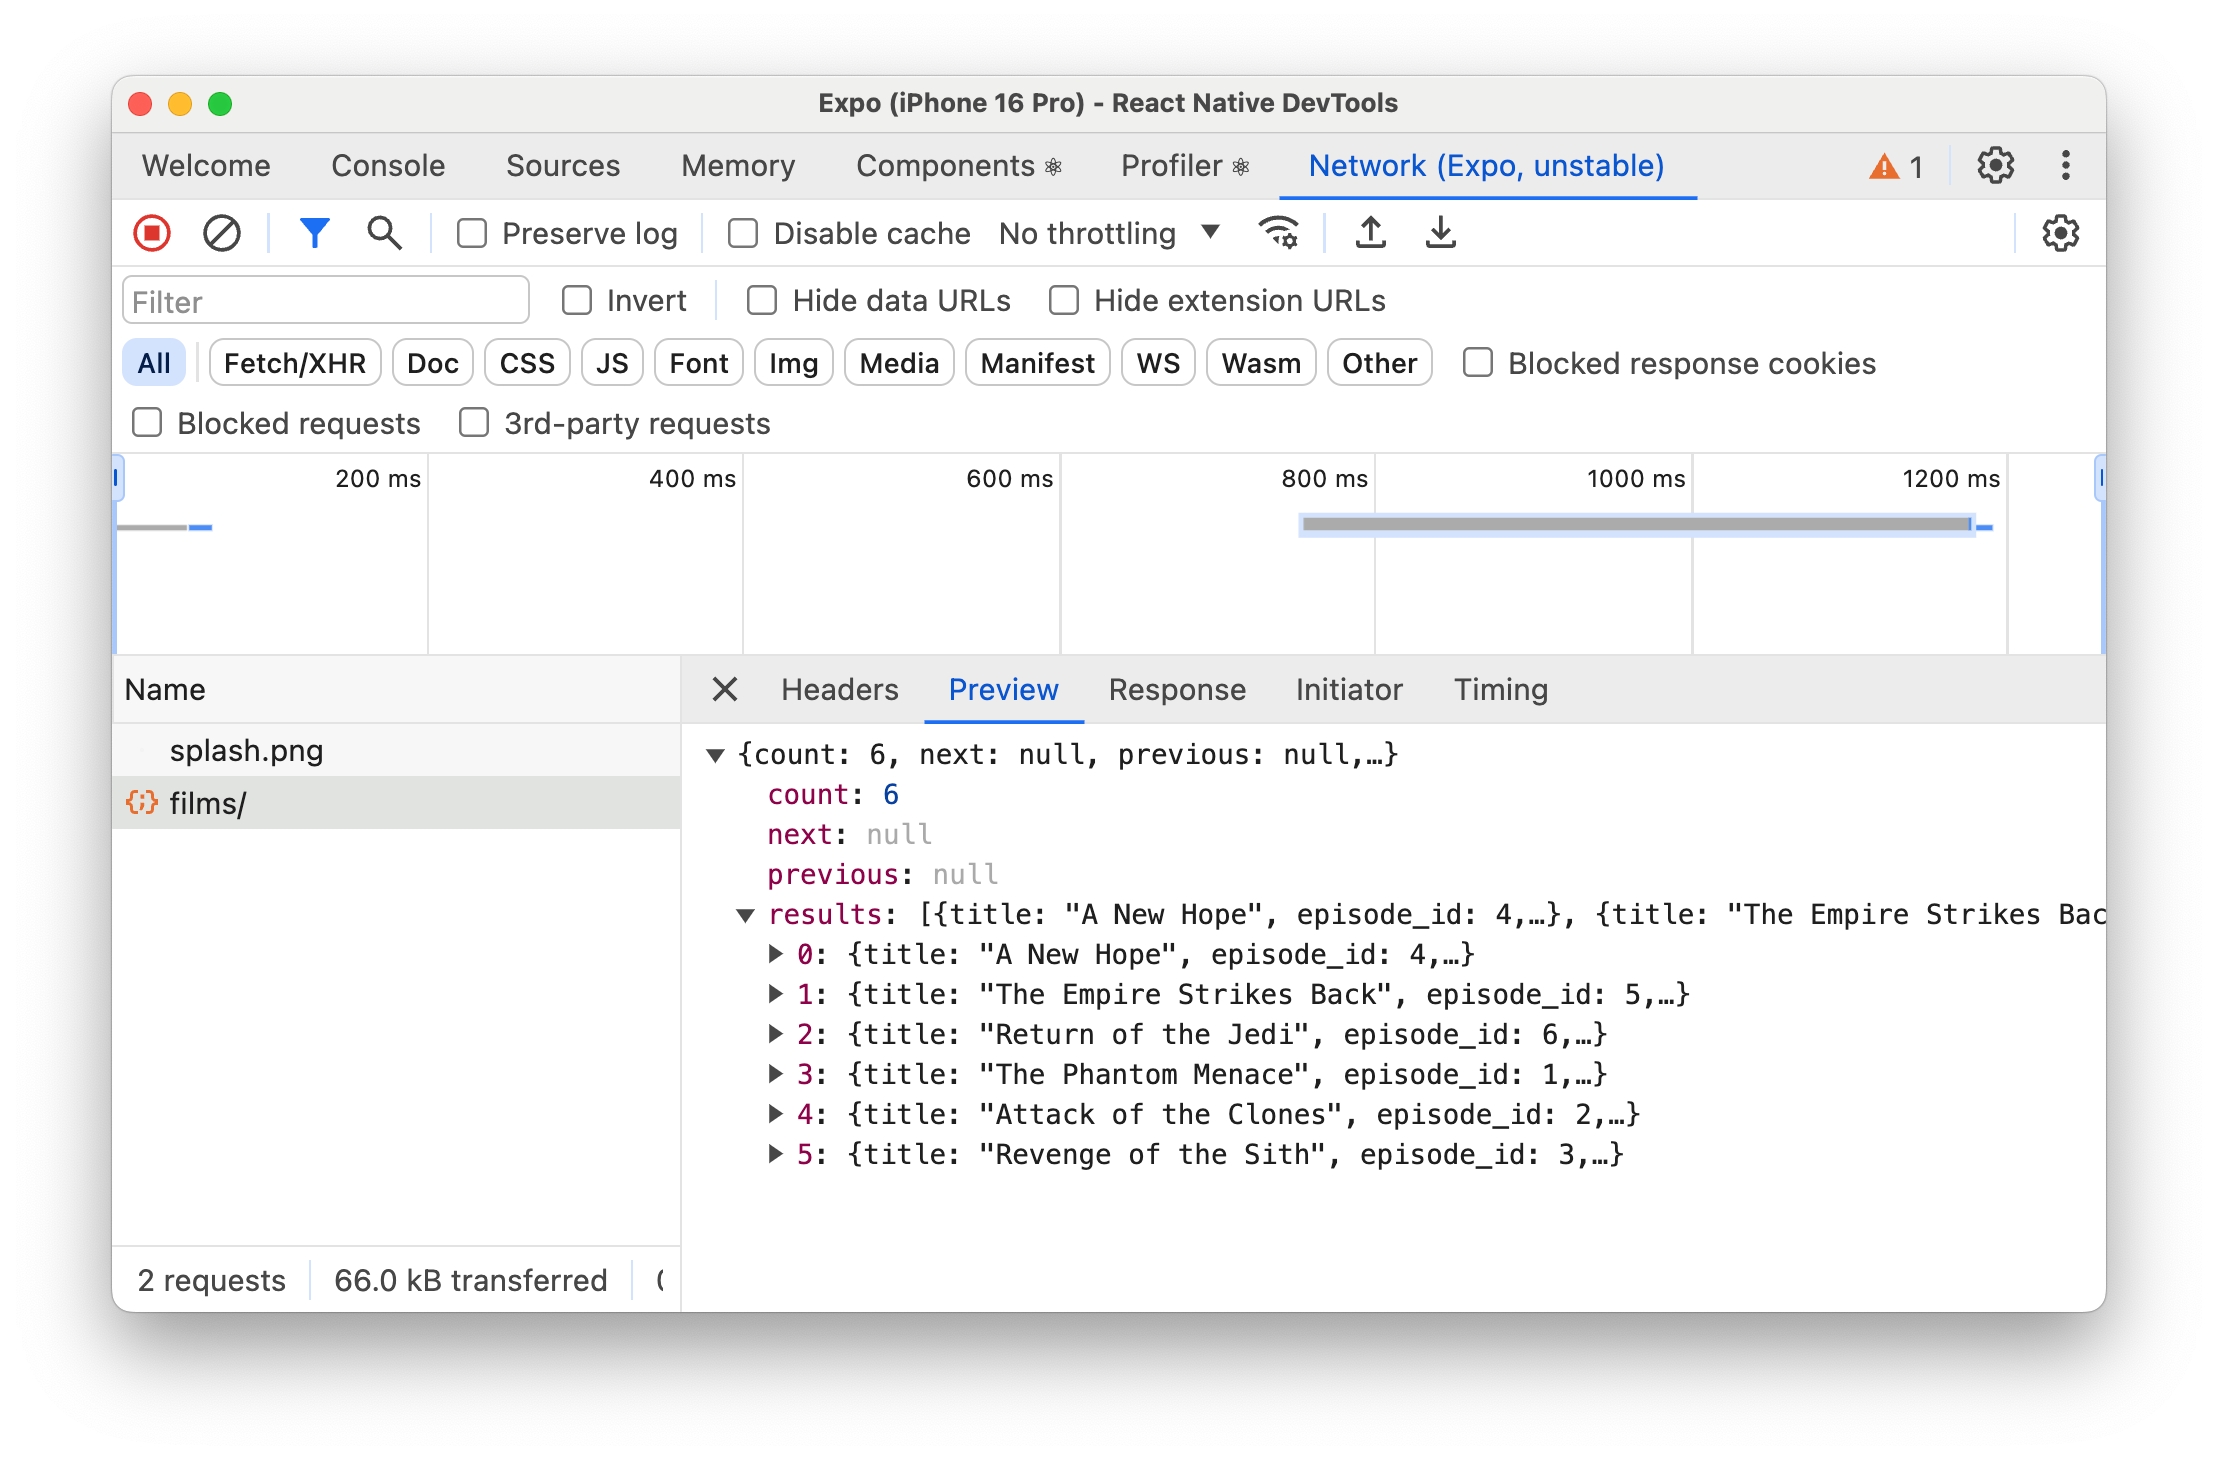
Beyond that, you can also use the Expo network tab to inspect network requests (marked as unstable, but eventually becoming core of the DevTools).
Thanks to the work of the React Native team, the new DevTools are a big improvement over the old ones and feel a lot more stable - including the ability to reconnect after a while.
Also, the ability to debug your components tree directly means you don't need another tool, and most React developers should be familiar with a view like this.
But all of this is just the beginning. The team has already planned the following features:
Performance panel: In progress (targeting next year).
Network panel: In progress (targeting next year).
Third party Chrome extensions: In early exploration, in collaboration with Expo (no ETA).
But there are still some gaps, and although I was hesitant at first, I've come to realize that Reactotron is still relevant.
Reactotron remains relevant
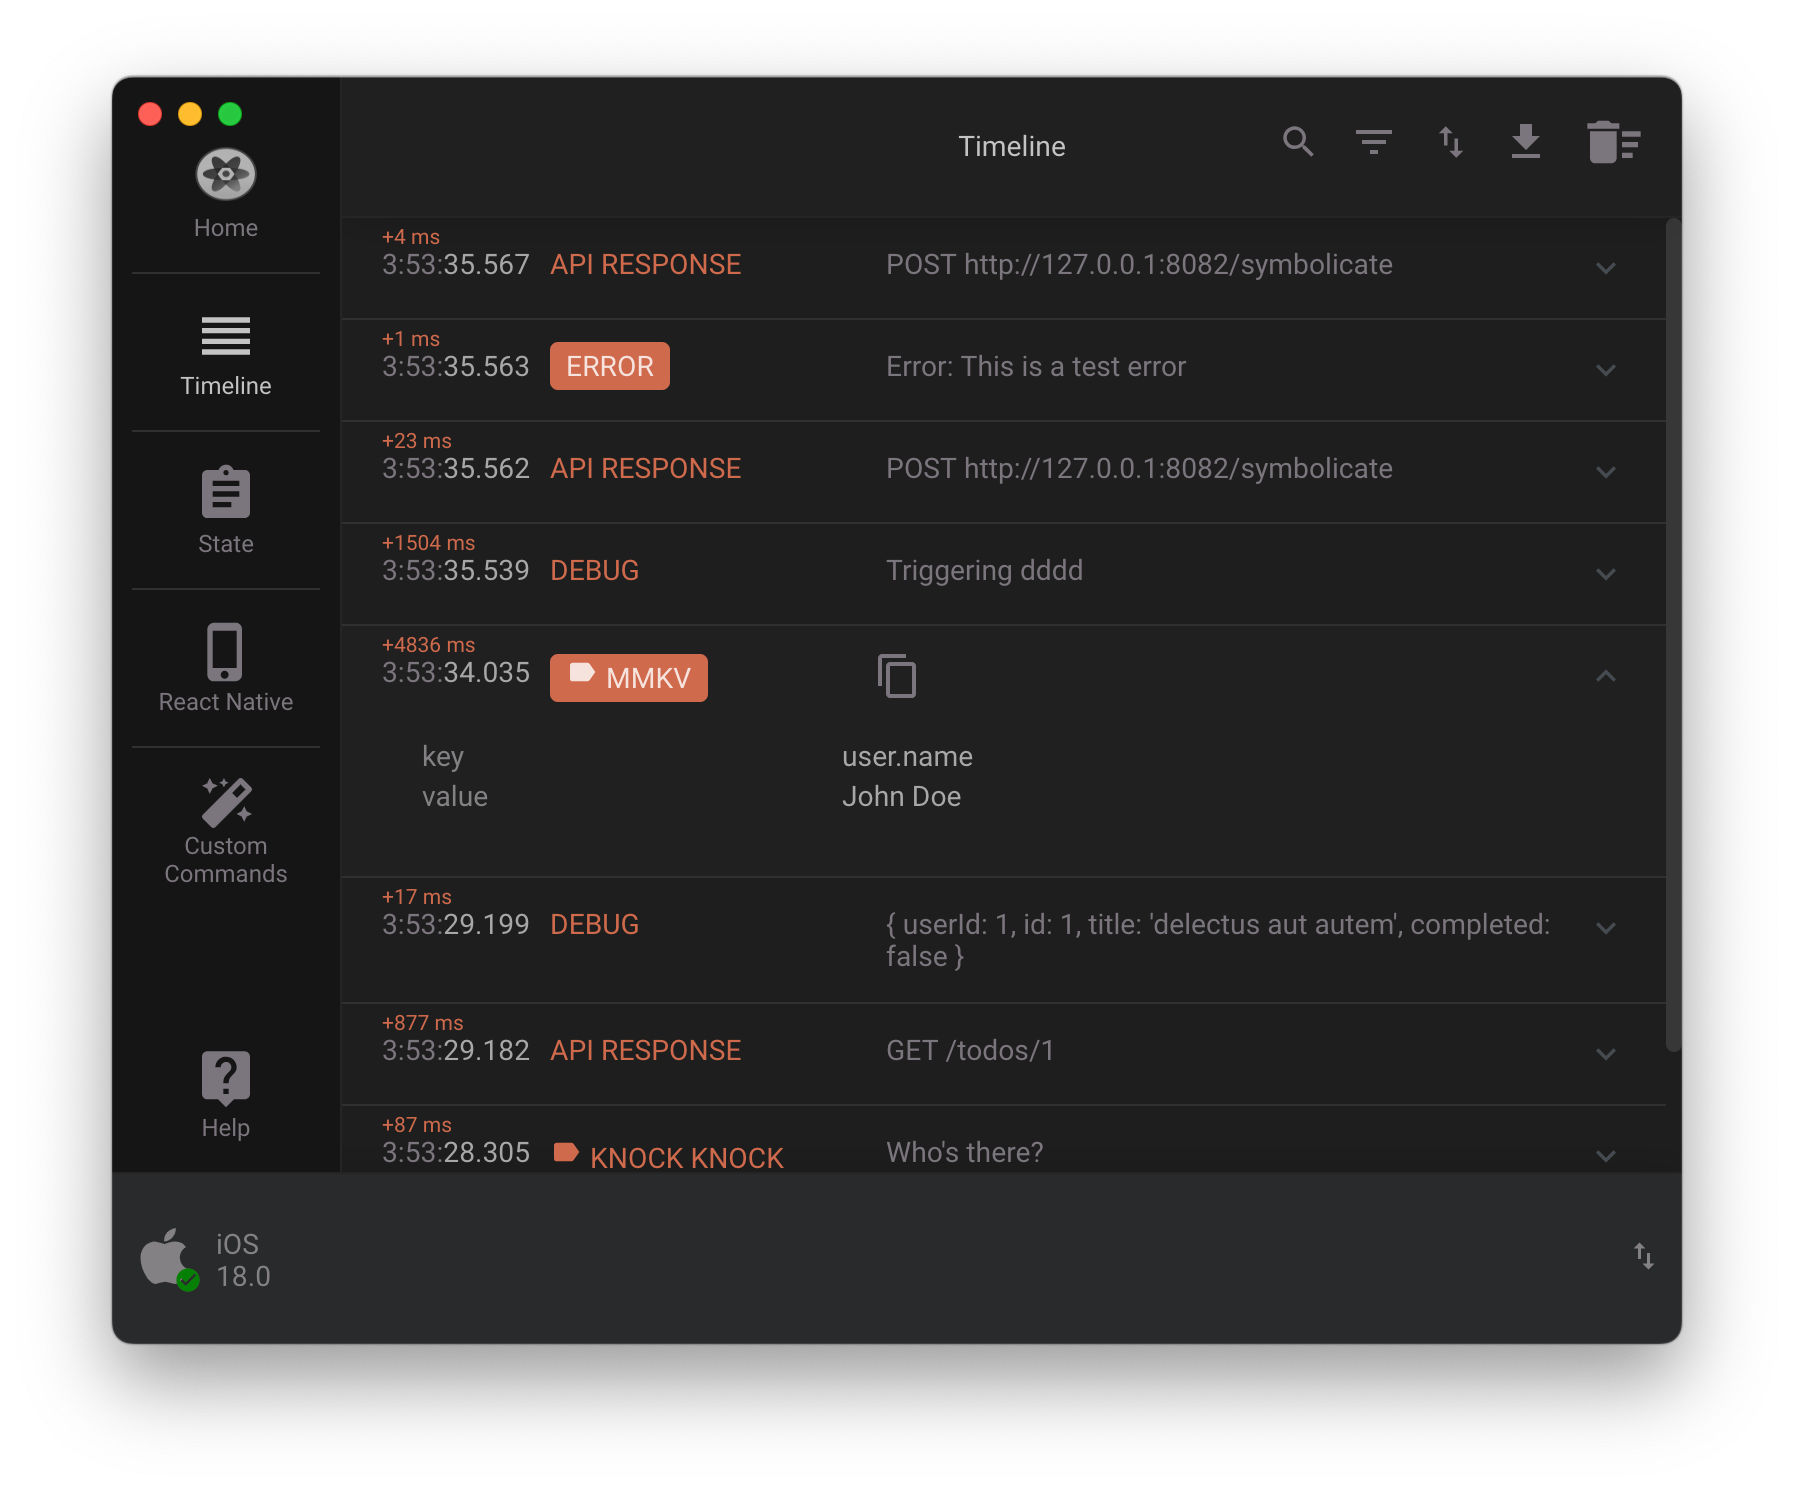
Reactotron is a powerful debugger for React and React Native applications, developed by Infinite Red.
On first look it might not appear as “modern”, but don’t get fooled by just the UI.
And while many of its features are now also available in the new React Native DevTools, there are still some gaps that Reactotron fills.
For example, Reactotron allows you to inspect the Redux store or MMKV storage, and it has a plugin system that allows you to add custom functionality.
Because it was internally developed by Infinite Red, Reactotron has a lot of real world applications, for example:
Image Overlays: Reactotron can show overlay your app with your designers mockups.
Benchmarking: Reactotron can help you do some quick benchmarking of your app.
React Native Async Storage: Reactotron can connect to your React Native Async Storage and show you the contents.
Because of these (and more) features, it's a great addition to your debugging toolbox, and every React Native developer should have Reactotron installed.
However, debugging your JavaScript code will only get you so far.
Using Native Debugging Tools
When you're debugging a React Native app, you're not just debugging JavaScript code - you're eventually debugging native code to trace down a problem.
And for this, you can rely on the native debugging tools for iOS and Android.
But for web developers, these tools are not always obvious, and opening Xcode or Android Studio might feel like entering a new world.
Therefore, let's take a look at both iOS and Android debugging options to see what they have to offer.
iOS Debugging with Xcode
Xcode is the official development environment for iOS, and it provides a lot of powerful debugging tools for the iOS part of your React Native app.
Keep in mind that building an iOS app and Xcode are only available on a Mac, so Windows users can’t access the following features:
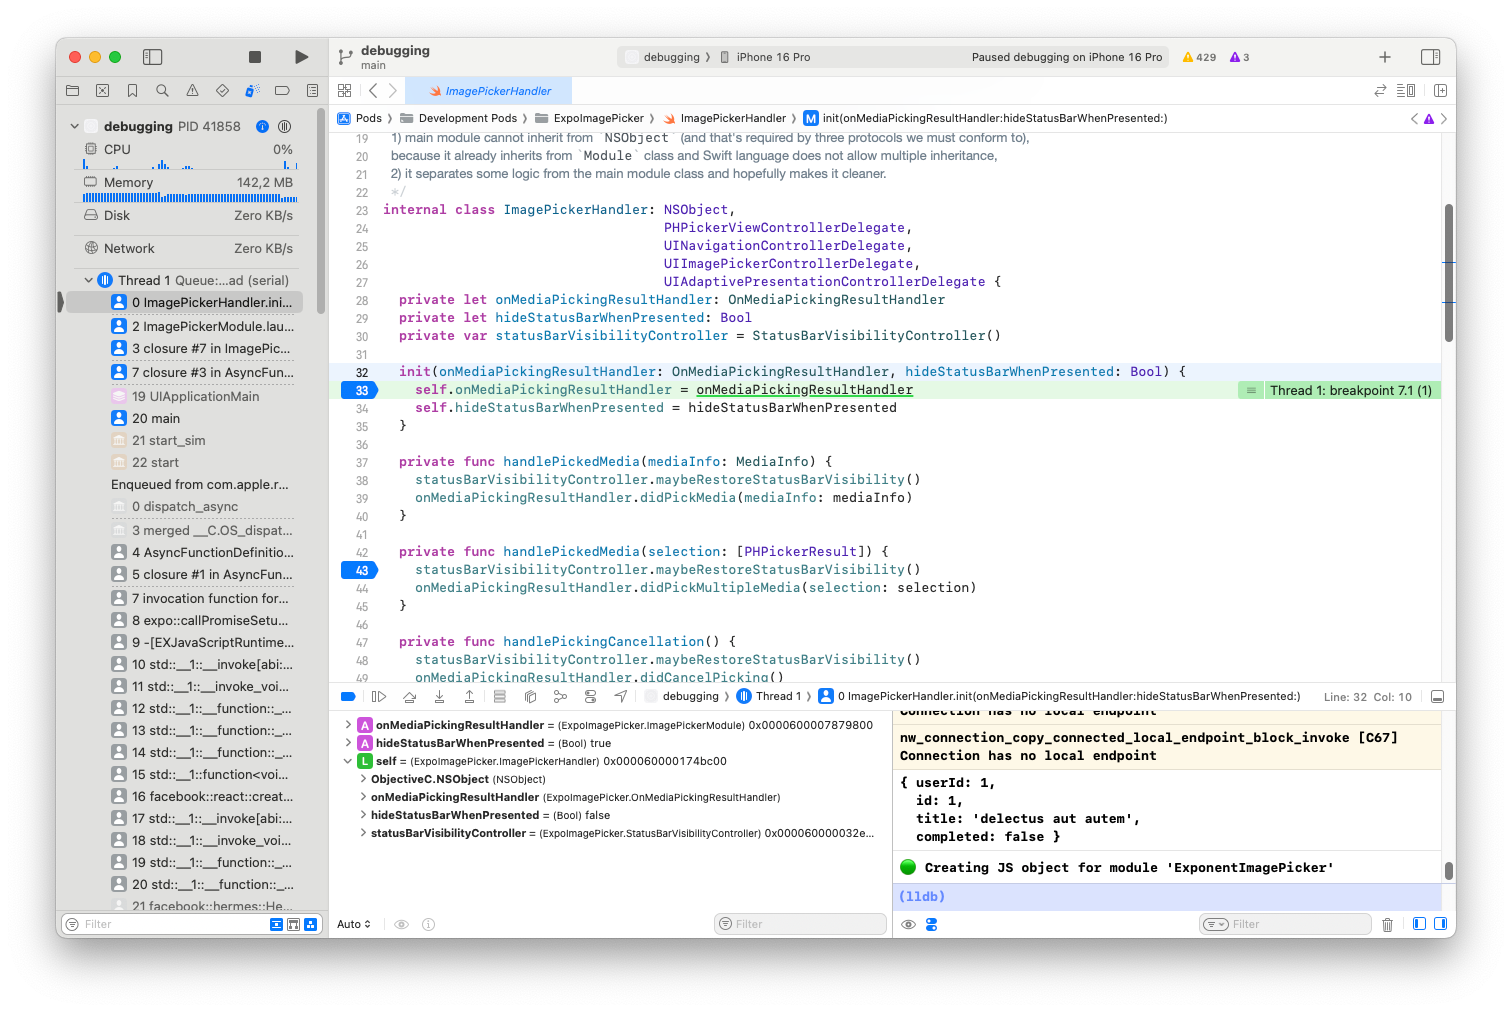
Console Output: View native logs and errors
Memory Debugging: Track memory usage and leaks
Network Inspector: Monitor network requests at the native level
View Hierarchy: Inspect native UI components
Breakpoints: Debug native Objective-C/Swift code
To debug your React Native iOS app, you first need to create a prebuild of your Expo app by running .
If you are unfamiliar with the different ways to build your Expo app, check out a video about it here.
This generates the native project, and you can now:
Open your file in Xcode
Select your target device/simulator
Click the Run button or press Cmd+R
Use the Debugging tools
In the example above, you can see a breakpoint being triggered when the native code of the Image picker was executed, something you couldn’t do from just Javascript debugging.
Especially when apps become more challenging and rely on the the best performance, dropping down into the native layer is a key skill for React Native developers.
Android Debugging with Android Studio
Android Studio offers similar debugging capabilities for the Android side, and is available on both Windows and Mac.
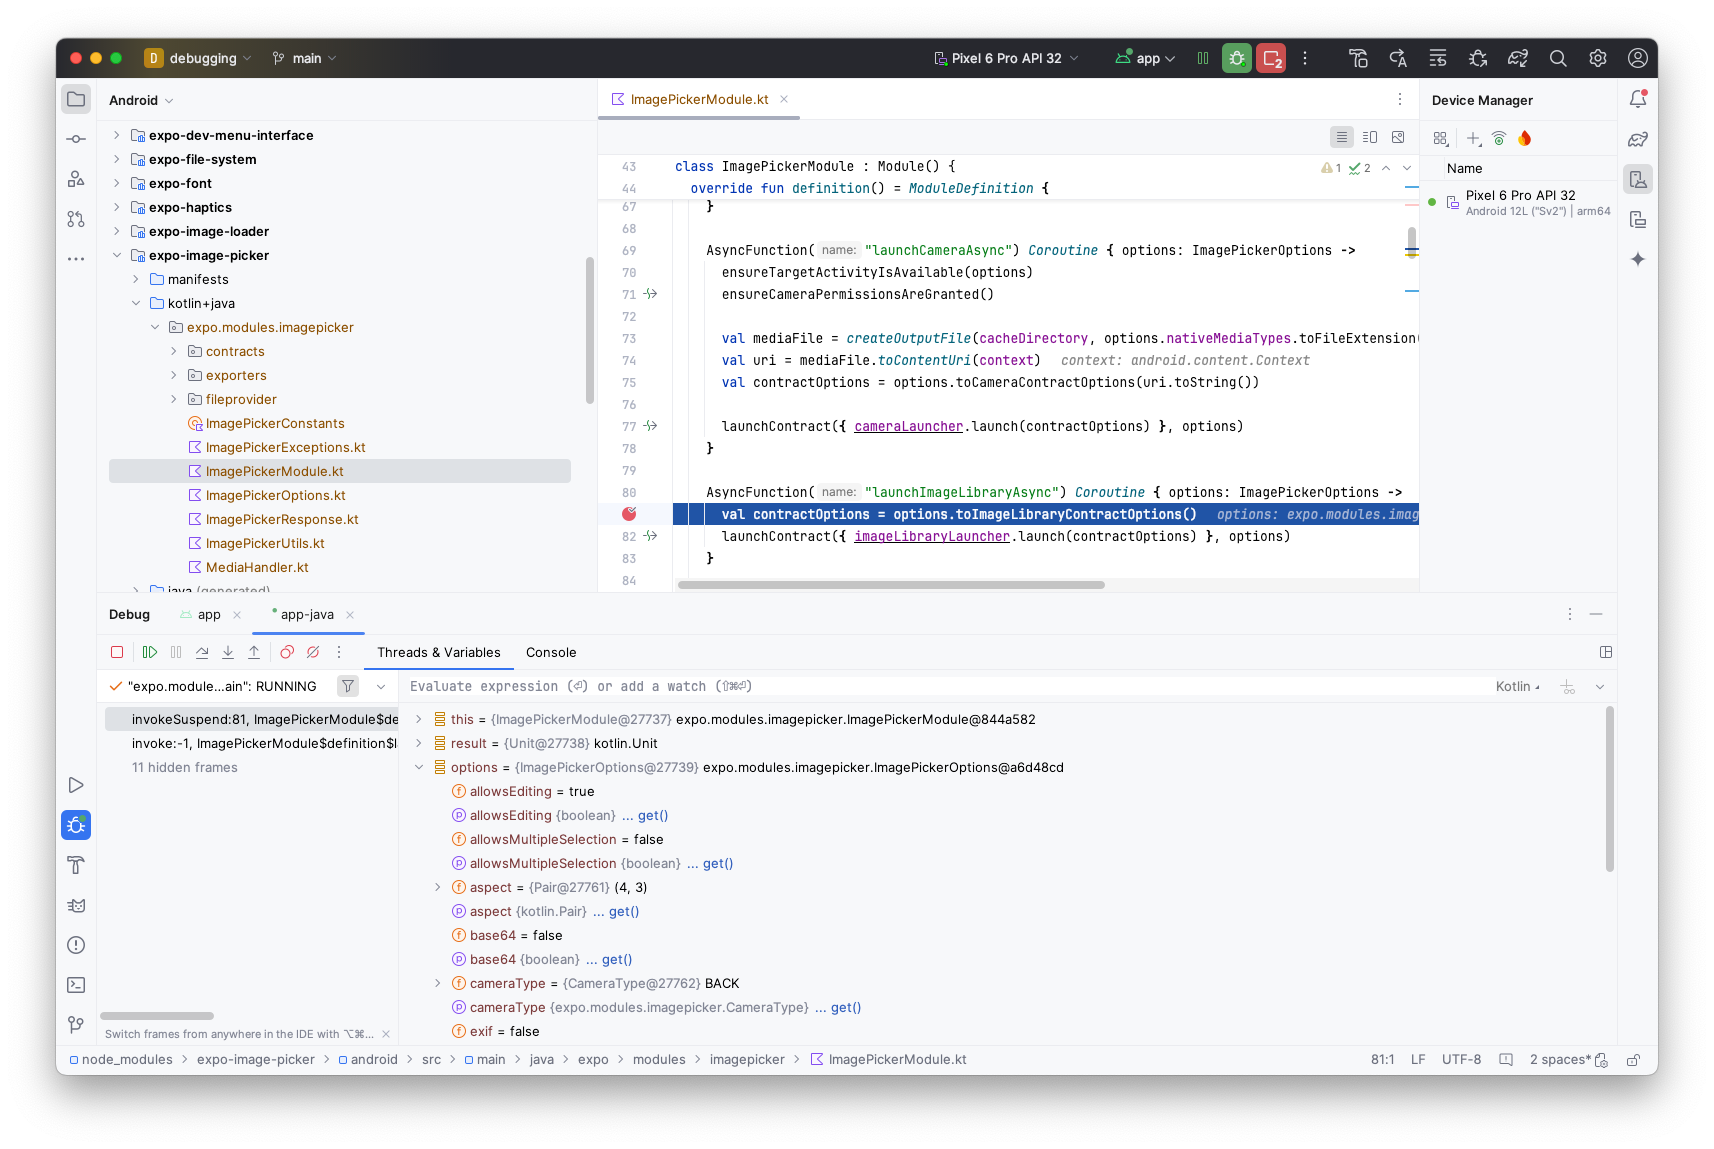
With Android Studio, you can use tools like:
Logcat: View system logs and app output
Layout Inspector: Analyze UI hierarchy
CPU Profiler: Monitor app performance
Memory Profiler: Track memory allocation
Network Profiler: Inspect network traffic
Just like for iOS, to debug your app you first need to create a prebuild by running npx expo prebuild -p android.
While the UI is inherently different, you basically follow the same principles to debug your app:
Open your project in Android Studio using the
/androidfolderSelect your device/emulator
Click Debug or press Shift+F9
Use the different profilers and tools in the bottom panel
Both platforms can help you understand what’s going on beneath your JavaScript code.
But you are always limited by your local environment, and while you might not see any issues (”it works on my machine”), your users might face severe problems.
What about User crashes?
Besides debugging your app, monitoring your app in production is just as important.
And that’s where Sentry comes in.
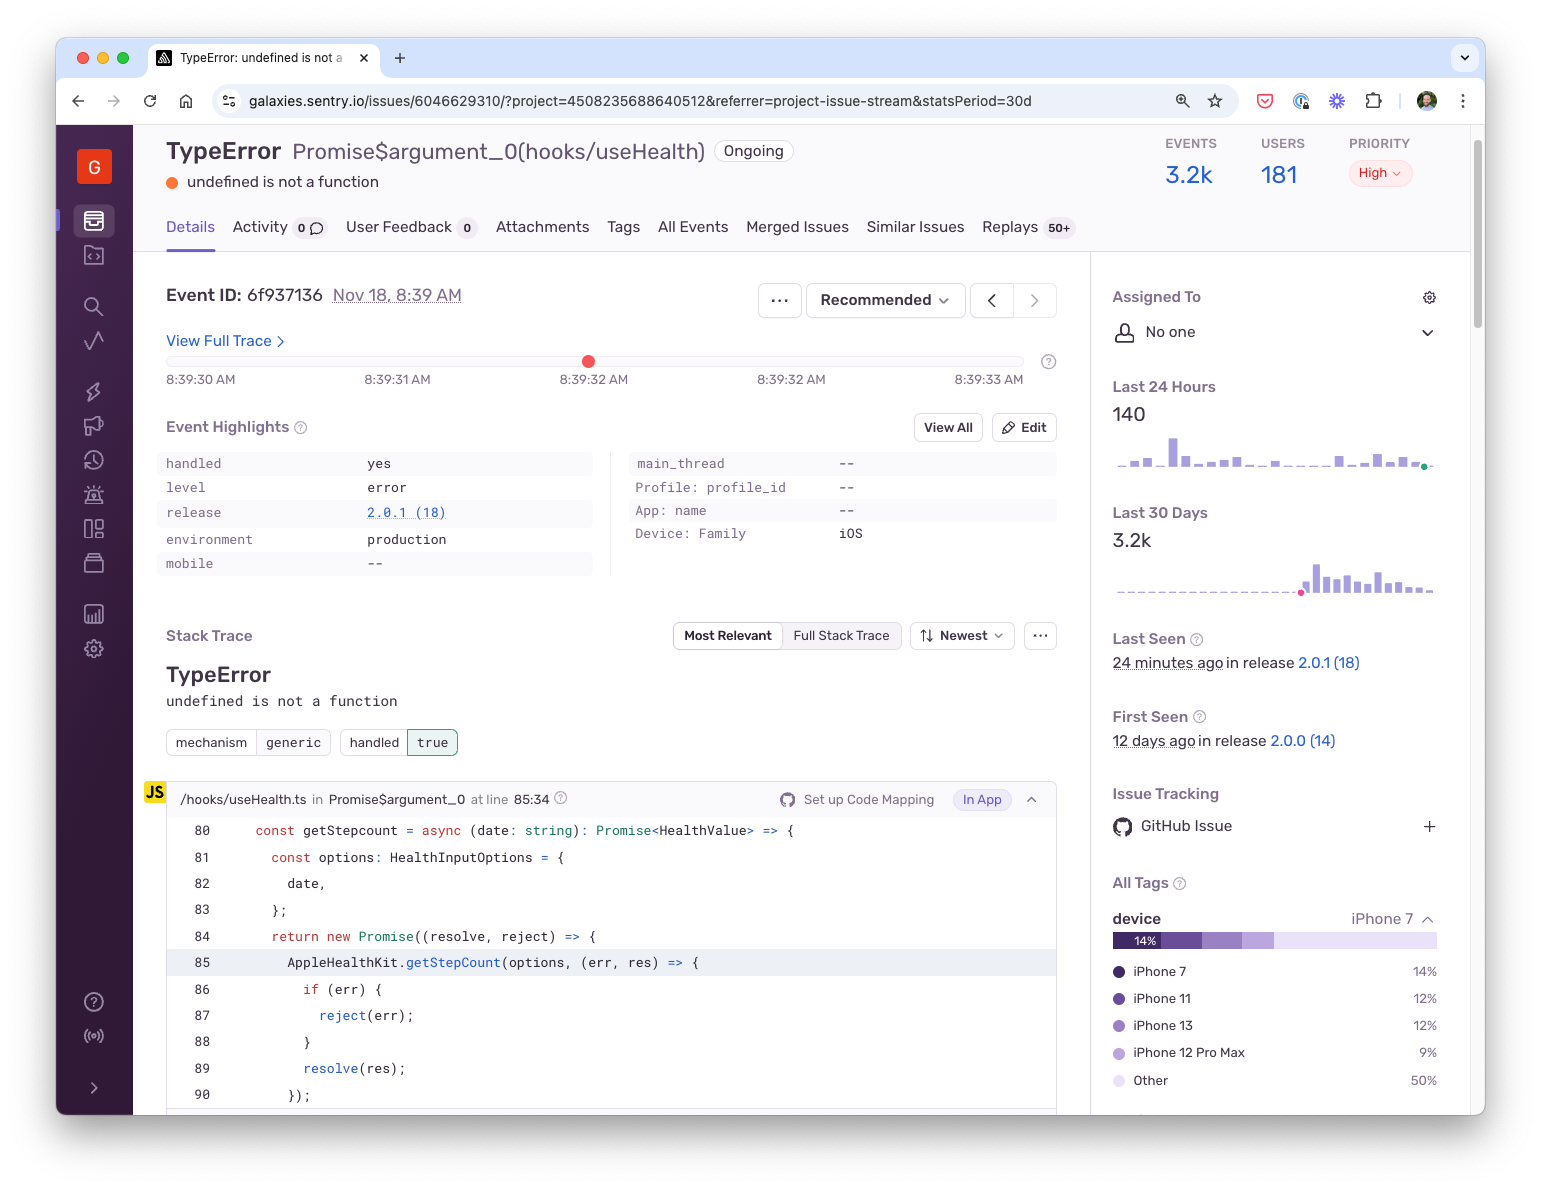
Sentry is a powerful application monitoring platform, giving you the last missing pieces of debugging and monitoring information to build stable and reliant React Native applications.
So while you are enjoying your precious weekend time with a well deserved hot chocolate (or your favorite beverage of choice), Sentry keeps monitoring your app.
And when you check back in, fixing a user crash is almost easy as Sentry presents all relevant information of a bug, including the exact line of code that triggered the problem!
Besides all the information about device type, app version etc., the latest addition to the Sentry suite of tools are Session Replays.
With Session Replay, you can now even see what a user did to cause a crash in the first place, or why the app behaved slow on their device.
Activating Session Replays for your React Native app is as easy as adding the new integration to the initialization of Sentry:
``` import * as Sentry from "@sentry/react-native"; Sentry.init({ dsn: "your-dsn", _experiments: { replaysSessionSampleRate: 1.0, // adjust in production replaysOnErrorSampleRate: 1.0, }, integrations: [Sentry.mobileReplayIntegration()], }); ```
With those settings, you can now understand what happened before, during and after an issue on the users device and simply replay it.
In the GIF above, you can also see that images, texts and inputs are masked. This is a privacy setting you can define for your app.
All of this means, you know have even more contextual and visual information about an issue that happened in your React Native App.
And especially about an issue that you most likely didn’t notice locally (or you would have fixed it)!
Know your React Native Debugging Tools
The new React Native DevTools are great, and will become even more powerful in 2025 and beyond.
However, there is always room for additional functionality (as provided by Reactotron), and understanding native iOS and Android debugging has to be a core competency of every experienced React Native developer.
Beyond that, local debugging will always be limited, and a platform like Sentry helps to monitor your app in the wild, so you can catch and solve issues faster.
If you’re a React Native developer, give the new Session Replay feature a try and share your feedback on GitHub or Discord.

