Robust Time Series Monitoring: Anomaly Detection Using Matrix Profile and Prophet
Robust Time Series Monitoring: Anomaly Detection Using Matrix Profile and Prophet


Anomaly detection is like being a detective in a house of mirrors: you know something’s not right, but you’re never quite sure if you’re looking at the real problem or just a weird reflection.
Monitoring production systems often feels like searching for a moving needle in a constantly shifting haystack. At Sentry, our goal was to empower customers to move beyond traditional threshold and percentage-based alerting. We aimed to help them detect subtle and complex anomalies in their systems in near real-time.
This post will detail how our AI/ML team developed a time series anomaly detection system using Matrix Profile and Meta’s Prophet. We'll cover the challenges we encountered and explain how this hybrid approach enabled us to build more reliable and intelligent alerting.
The Problem: Noisy Metrics, Subtle Failures
System metrics are inherently noisy, yet pinpointing the right anomaly at the right time can drastically alter an outcome, from a quick fix to a full-blown incident. However, automatic Time Series Anomaly Detection, aka TSAD, is not a trivial problem.
Context is everything: A spike in data might be an anomaly—or just a weekend sale, a product launch, or a system maintenance event. Without context, it's hard to tell the difference.
"Normal" is a moving target: Patterns evolve over time. Seasonality, trends, and sudden regime shifts all mean what’s normal today might be anomalous tomorrow.
Noise vs. signal: System metrics data is often noisy. Detecting true anomalies without triggering constant false positives is tricky, especially at scale.
One size doesn’t fit all: Each metric behaves differently. CPU usage, user signups, transaction volumes—each has its own characteristics, requiring tailored approaches.
Lack of labeled data: Supervised learning is hard when there's no ground truth. Often, nobody knows exactly what the anomalies are until something breaks.
Sentry scale: Now think of overcoming all this at the scale of an observability platform like Sentry that supports monitoring hundreds of thousands of metrics.
In short, automatic TSAD has to be context-aware, adaptive, precise, and scalable - all at the same time.
The Solution: A Hybrid Approach
After extensive experimentations with various models such as ARIMA, SARIMA, TimeGPT, Moirai, AutoFormer, and ChatTS, we settled on a hybrid method that combines Matrix Profile and Prophet. Together, these models provide a broader and more nuanced understanding of anomalies in time series data.
Matrix Profile: Shape-based Anomaly Detection
Matrix Profile is an unsupervised technique that identifies repeated patterns (motifs) and outliers (discords) in time series by comparing subsequences. It calculates the distance to the nearest neighbor subsequence for each subsequence within a time series; large distances indicate unusual or anomalous behavior. This technique is ideal when the shape of the data (spikes, dips, or repetitive cycles) is more critical than exact values.
Why We Chose It:
Detects anomalies based on similarity, not just raw values.
Efficient, thanks to the STOMP algorithm.
Doesn’t need pre-training.
Has only one hyper-parameter: the window size.
Prophet: Seasonality-aware Forecasting
Meta’s Prophet is a decomposable time series forecasting model designed to handle daily, weekly, and yearly seasonality, and it can incorporate known events (e.g., deploys, holidays). We leverage Prophet’s predictions to adjust anomaly scores, thereby reducing false positives caused by expected trends or cycles.
Why We Chose It:
User-friendly and robust to missing data.
Effectively captures trends and seasonality.
Generates confidence intervals to identify outliers.
Putting it All Together: Turning Raw Anomalies to Actionable Alerts
Matrix Profile flags discords (anomalous shapes).
Prophet forecasts the expected value and identifies large residuals.
An alert is triggered if both methods detect an anomaly, or if one detects an anomaly with high confidence.
This hybrid model gives us both short-term anomaly sensitivity and long-term trend awareness. Or that was the idea. Reality turned to be a bit more complicated than that. Building a robust anomaly detection system wasn't just about picking the right models. Turning raw anomaly signals into actionable alerts at scale required some serious experimentation, innovation and system design.
Starting with the Basics: The Data
In God we trust, all others bring data.
Yes, we got our data too. Cannot do much experimentation without it, can we now? So, like all good data scientists, we started with an existing industry standard dataset, the UCR’s Time Series Classification Archive. Soon enough we hit its limitation - it does not cover observability domain much. So we generated our own synthetic data and also leveraged existing metric data from Sentry.
All in the Algorithms
Algorithm: Word used by programmers when they do not want to explain what they did.
Identifying fleeting trends within vast datasets presents a significant challenge in anomaly detection, largely dependent on the "window size" which is a key hyper parameter for the Matrix Profile. This often finicky setting is crucial for system performance. After evaluating various auto-tuning methods, we found Summary Statistics Subsequence (SuSS) to be the most effective. SuSS intelligently identifies the optimal window by comparing local and global summary statistics (mean, standard deviation, and range), thereby pinpointing the precise context for accurate anomaly detection.
Then came the challenge of transforming raw Matrix Profile distances into clear, actionable anomaly scores. Our AnomalyScorer module evaluates these distances, which represent how unique each subsequence is, and uses configurable thresholds and optional Prophet forecasts to assign a precise anomaly score to every data point. We've built in flexibility, incorporating statistical thresholds (like the 99th percentile of distances), dynamic baselines, and even ensemble logic for combining multiple algorithms. The outcome is a robust, interpretable score for each timestamp, which we then binarize into simple "anomaly" or "none" flags for downstream alerting and visualization. This modular design means we can fine-tune sensitivity, slash false positives, and adapt to any kind of time series data.
Choppiness during recovery from an alert was another big challenge we faced. This was due to the nature of Matrix Profile - a momentary error spike can result in multiple alerts in a 50 hour period just because the window size was 50. To fix this, we implemented smart solutions: majority voting-based smoothing and Prophet-based recovery logic. The result? Our system now knows when to quiet down after a true anomaly and suppress alerts when it has high confidence. So our alerts become more meaningful and are not overwhelming.
Scaling the System to Handle Thousands of Metrics
Scaling anomaly detection is like training your dog to sleep in a weird position on command, and then expecting him to do it for every dog in the entire dog park!
Both Matrix Profile and Prophet are incredibly powerful, but with great power comes great resource intensity. Thousands of data points per time series meant significant computation time. Our solution? A two-pronged attack! We process data in a daily batch mode, pruning it and fitting our models. Then, for new incoming data, we leverage stream computation for lightning-fast Matrix Profile and Prophet predictions. To further ease the burden on our event datastore, we also cache aggregated data for a rolling 28-day period. Efficiency, unlocked!
Adding Configurability to the Mix
We understand that not all metrics are created equal. That's why we wanted to give our users control, offering three distinct sensitivity levels to match their specific problem domain and desired alert volume. How did we achieve this? First, we built an extensive internal dataset, packed with synthetic and real-world time series, showcasing everything from issue counts to failure rates, each with wildly different seasonal patterns and variances. Then, through rigorous testing and hyper-parameter adjustments across our algorithms, we fine-tuned the system until we hit the sweet spot for accuracy.
The Results
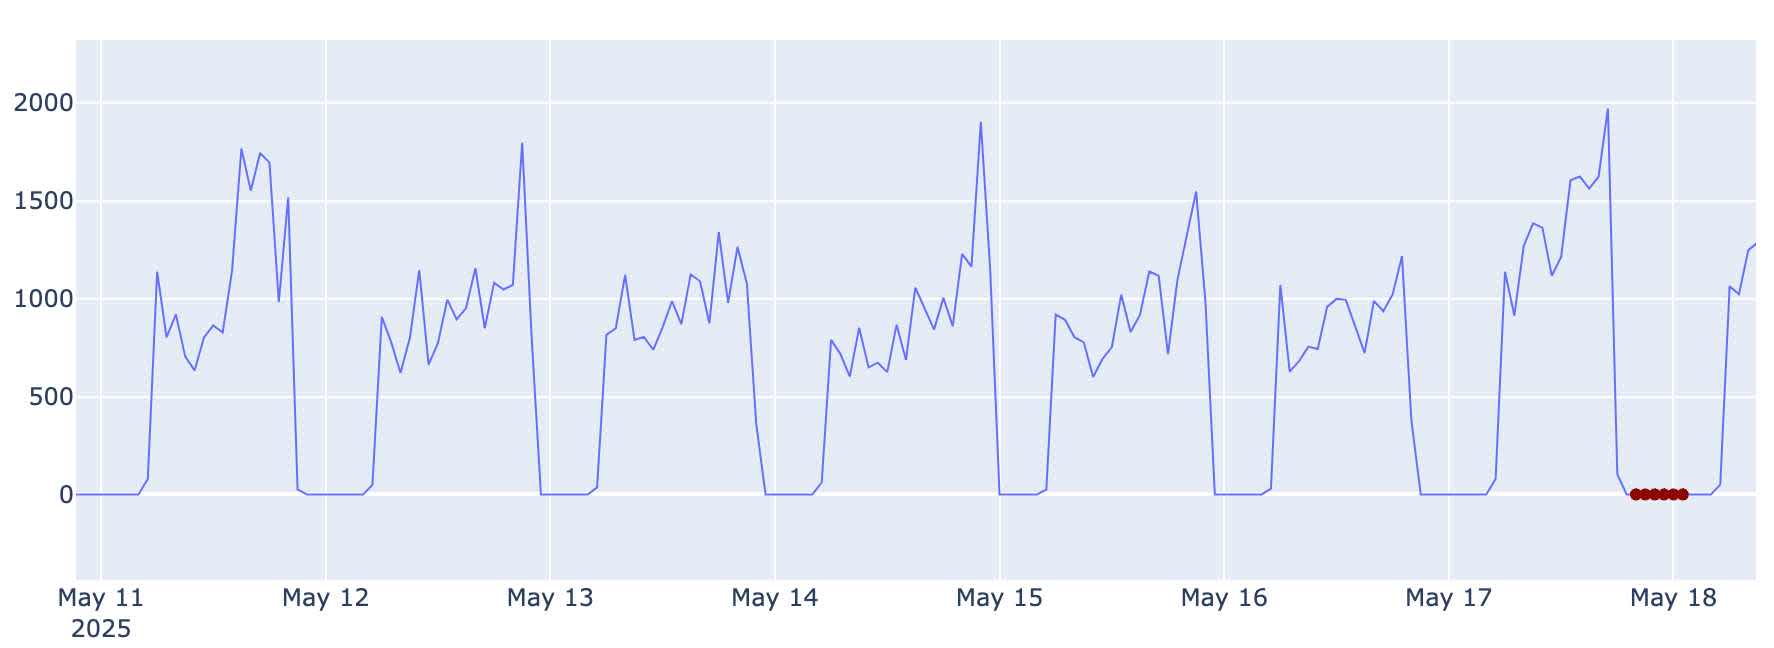
Below are some of the compelling results observed in production. The first example looks like a false positive at first glance. On closer look, you can see that the system has noticed that the last valley started much earlier in the day than usual and called it.
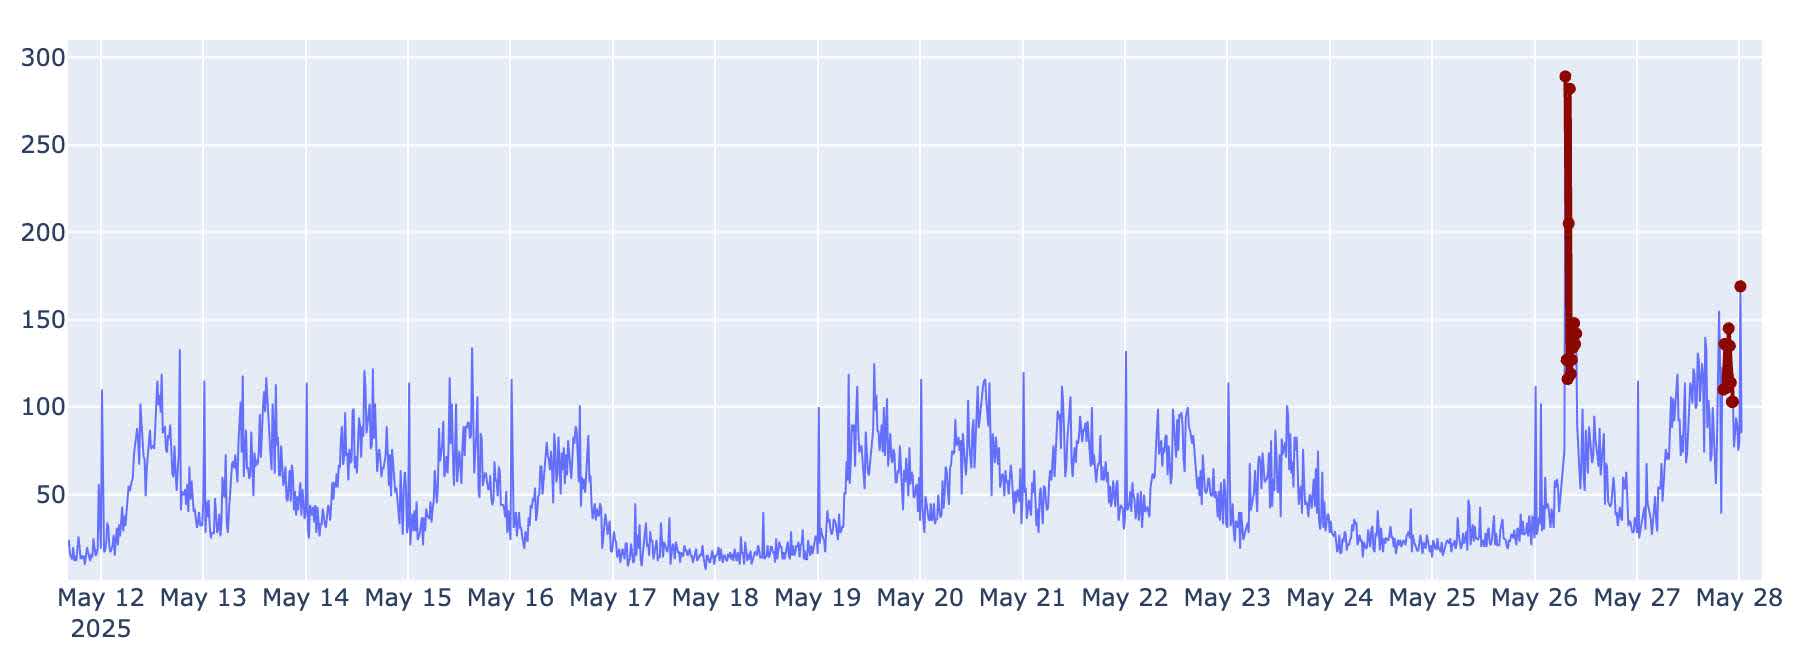
This second example shows a noisy time series that has weekly and daily cycles. Again our system did a good job of calling out anomalous system behavior that may have previously gone unseen to an untrained eye.
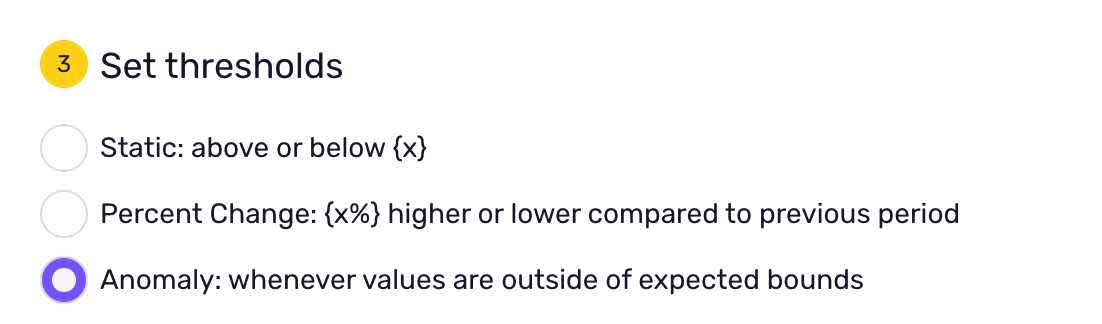
Leveraging Our Anomaly Detection System
Head to the alerts configuration page and select Anomaly Detection as your threshold option, that is it.
Final Thoughts and What’s Next
We are currently working on:
Incorporating anomaly feedback from users to continuously refine our models.
Performing causal analysis across multiple time series.
Anomaly detection in time series at scale presents a non-trivial challenge. By combining multiple models with complementary strengths and integrating custom algorithms to address weaknesses, we’ve built a system that significantly enhances your ability to monitor production systems.