Trace Errors Through Your Stack Using Unique Identifiers in Sentry
Trace Errors Through Your Stack Using Unique Identifiers in SentryThis content is out of date
Since this blog was published a lot of improvement have been made to distributed tracing at Sentry. Sentry will now automatically trace between backend, frontend and mobile projects. Please see our docs for the latest info.
Imagine you, dear reader, have an e-commerce website (it’s 2019, after all) where you sell artisanal hot dogs. This site is built on several services that talk to each other to make sure your customers can easily purchase their organic, grass-fed hot dogs.
But what happens when these services stop behaving as expected and suddenly your front-end shows “500: Internal Server Error”? Without monitoring for errors on each service, you'll have to dig through the available logs and hopefully, eventually, figure out that a bug within one of the many services causes this 500 error.
Ultimately, you can spend a lot of time and effort searching for bugs in this way — navigating back and forth between various monitoring and logging solutions to find the root cause. But why spend that time and effort when you don’t actually need to?
Tracing: uncover an error's full story
Instead, you can send errors from each service to an application performance monitoring platform like Sentry and correlate them using a unique identifier, allowing you to trace the error and pinpoint the service and code behaving unexpectedly.
You need to complete a few steps, including:
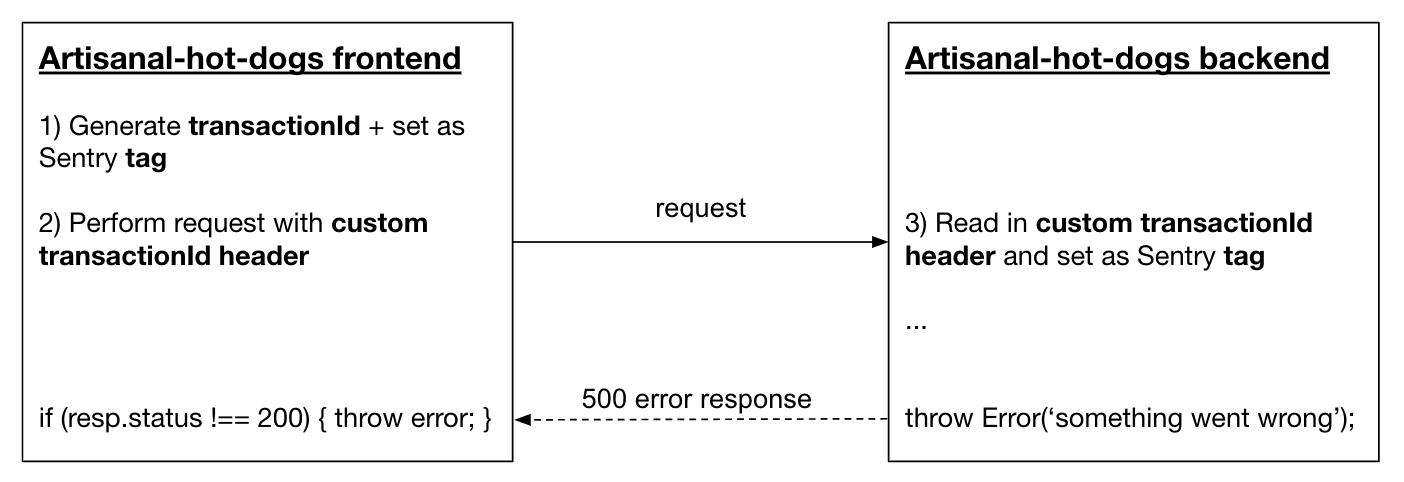
Generate a unique transaction identifier and set it as a Sentry tag in the service issuing the request.
Set the transaction identifier as a custom header when making the request.
Parse the transaction header and set it as a Sentry tag in the receiving service.
In the diagram below, we use transactionId as the unique identifier.
Now if there are errors on both services due to the failed transaction or request, the errors will have the same transactionId identifier set as a tag. Tracing the 500 error shown on the front-end to the actual error in the back-end would look something like this:
How to Set-Up Tracing in Sentry
Let's go through an example with our artisanal hot dog vendor site: a simple web application with a front-end written in JavaScript and a server written in Node.js. Let's assume that these services are both already configured with Sentry using Sentry's JavaScript SDK.
1. Generate a unique identifier and set it as a Sentry tag on issuing service
First, generate a unique identifier from the service issuing the request (e.g., your client JavaScript code). This unique identifier could be a transaction ID or a session ID created when the web application first loads. Set this value as a Sentry tag using the Sentry SDK. Below, we use a transactionId as our unique identifier:
// generate unique transactionId and set as Sentry tag
const transactionId = Math.random().toString(36).substr(2, 9);
Sentry.configureScope(scope => {
scope.setTag("transaction_id", transactionId);
});2. Transmit the unique identifier as a custom header and handle error(s) appropriately
When initiating the request, set this same identifier as a custom request header. If the request fails, handle it so that Sentry's SDK will collect the error (either manually throw it, or capture it using Sentry.captureError or Sentry.captureMessage).
// perform request (set transctionID as header and throw error appropriately)
fetch('https://my.artisanal-hot-dogs.com/checkout', {
    method: 'POST',
    headers: {
      "X-Transaction-ID": transactionId
    },
    body: order
})
.then(function (response) {
    if (response.status !== 200) {
        throw new Error(response.status + " - " + response.statusText);
    }
})
.catch(function (error) {
    throw error;
});
3. Extract the header on the receiving service
In the receiving service (the server responding to the request), extract the unique identifier, in our case tranactionId custom header, and set it as a Sentry tag. This means that both services should have set the same tag key/value pair.
let transactionId = request.header('X-Transaction-ID');

if (transactionId) {
    Sentry.configureScope(scope => {
        scope.setTag("transaction_id", transactionId);
    });
}
Et voilà! Now, errors caused in this transaction or session can be traced/correlated using the unique identifier.
While the tracing example used here correlates an error from the front-end to the backend, tracing can be applied to anything that communicates to another thing, like one microservice to another microservice, and even correlates items or entries within developer tools. Take a look at how we used Sentry and nginx to trace errors to logs.
You can also see an example of how we implemented error tracing within Sentry here.


