Tracing errors and surfacing collateral damage across your code base
Tracing errors and surfacing collateral damage across your code base
Frontend technologies typically talk to several services in your backend, and those services talk to other services. At the root of every issue is a single event that causes a domino effect. A domino effect that impacts every operation from the first experience on the frontend to the backend API call. Sentry can show you how these exceptions and latency issues impact every one of your services.
For example, take the ever common and seemingly simple to resolve 500 - Internal Server Error. In the sample issue below we see that someone is trying to check out of our ecommerce shop.
Clearly, the customer is experiencing this issue on the front end and we definitely need to fix this, but is that really the root cause? If you aren’t monitoring your frontend and backend, you are only getting half the story. This can mean an endless game of debugging whack-a-mole, and lots of “what the…?” moments until calling it a day and rolling back the release.
Seeing what really matters
Back to this 500 Internal Server Error issue. Sentry told us that the exception was caught in our JavaScript project and it’s related to the checkout flow. But it seems that there are some related issues.
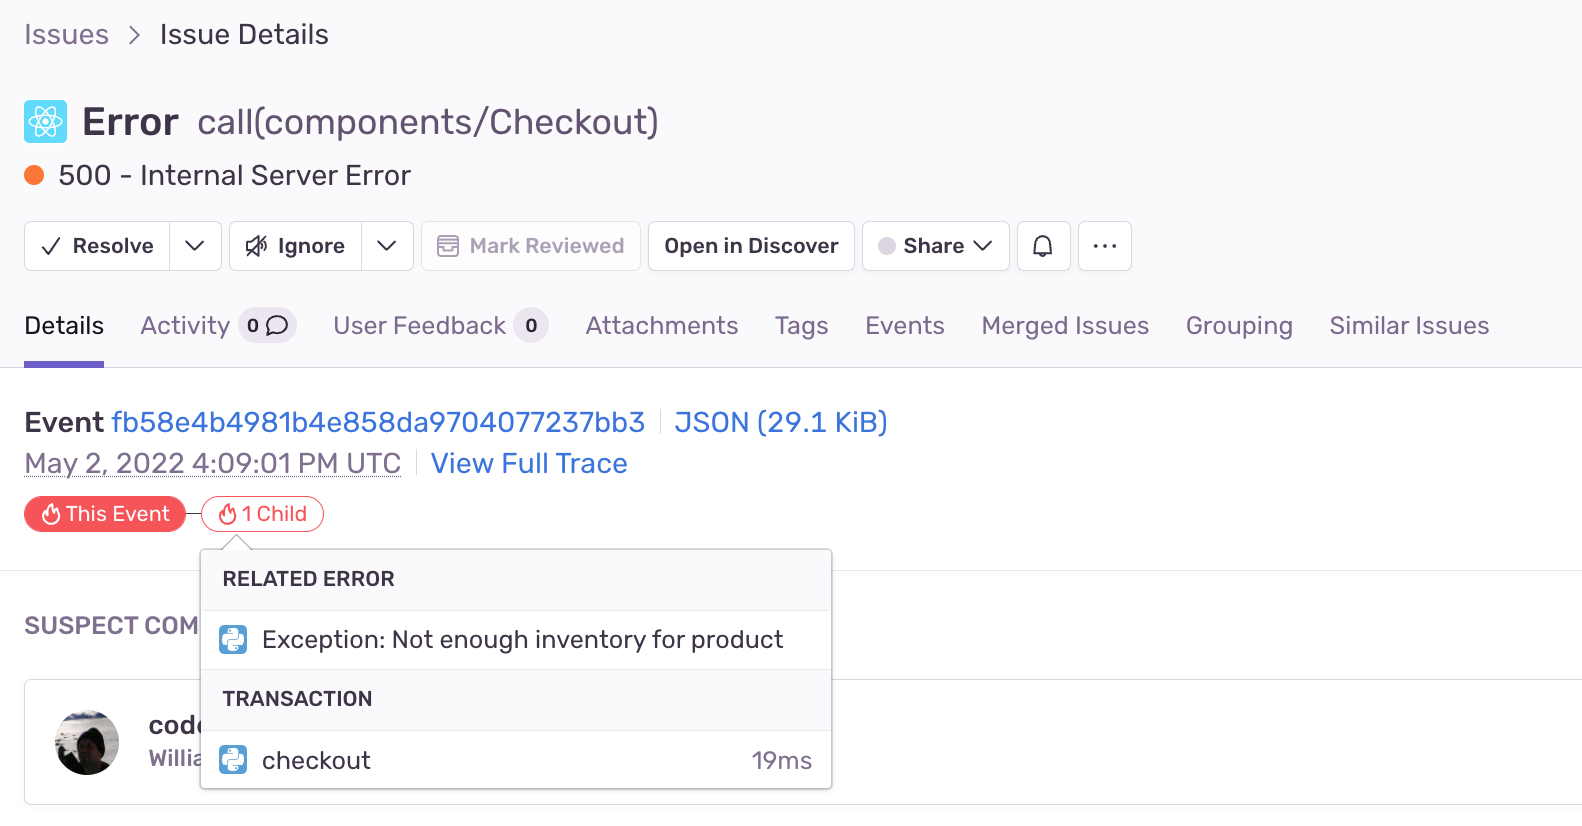
At the top of the Issue Details view is a minimap, we call Trace Navigator. You can follow the trace from one project to any dependencies in another. Trace Navigator looks across all your projects to identify related errors and performance issues.
In this case, there are two related problems: an error on the frontend and an unhandled exception for when we’re out of inventory on the backend. Additionally, we’re seeing a pretty slow experience as a side effect of the broken checkout flow. Because we have Sentry looking at our JavaScript and Python projects, the problem is obvious – people can’t buy things we don’t have.
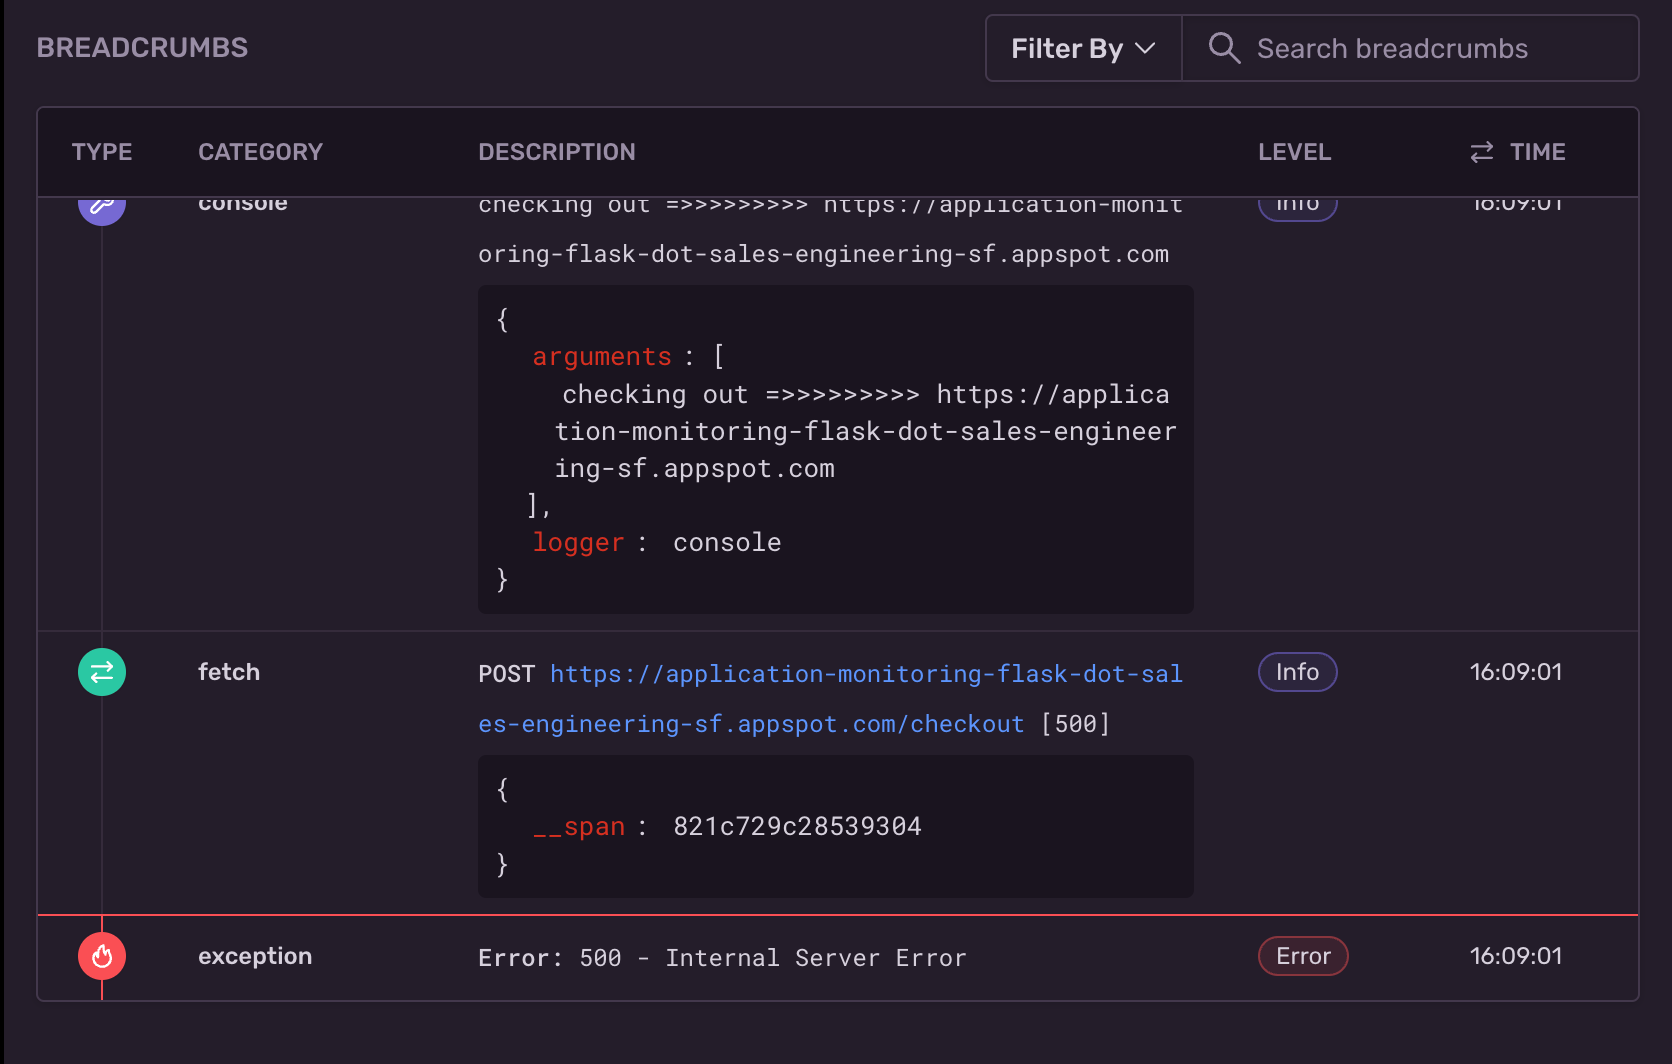
But humor me for a minute. Let’s walk through what this would look like if we didn’t monitor our whole code base. The 500 error would give us only one clue: the time. In order to see what’s really going on, we’d have to comb through the logs and look at each event around the same time the 500 error fired. After that, we’d try to recreate the error based on which events in the logs we thought might be the culprit.
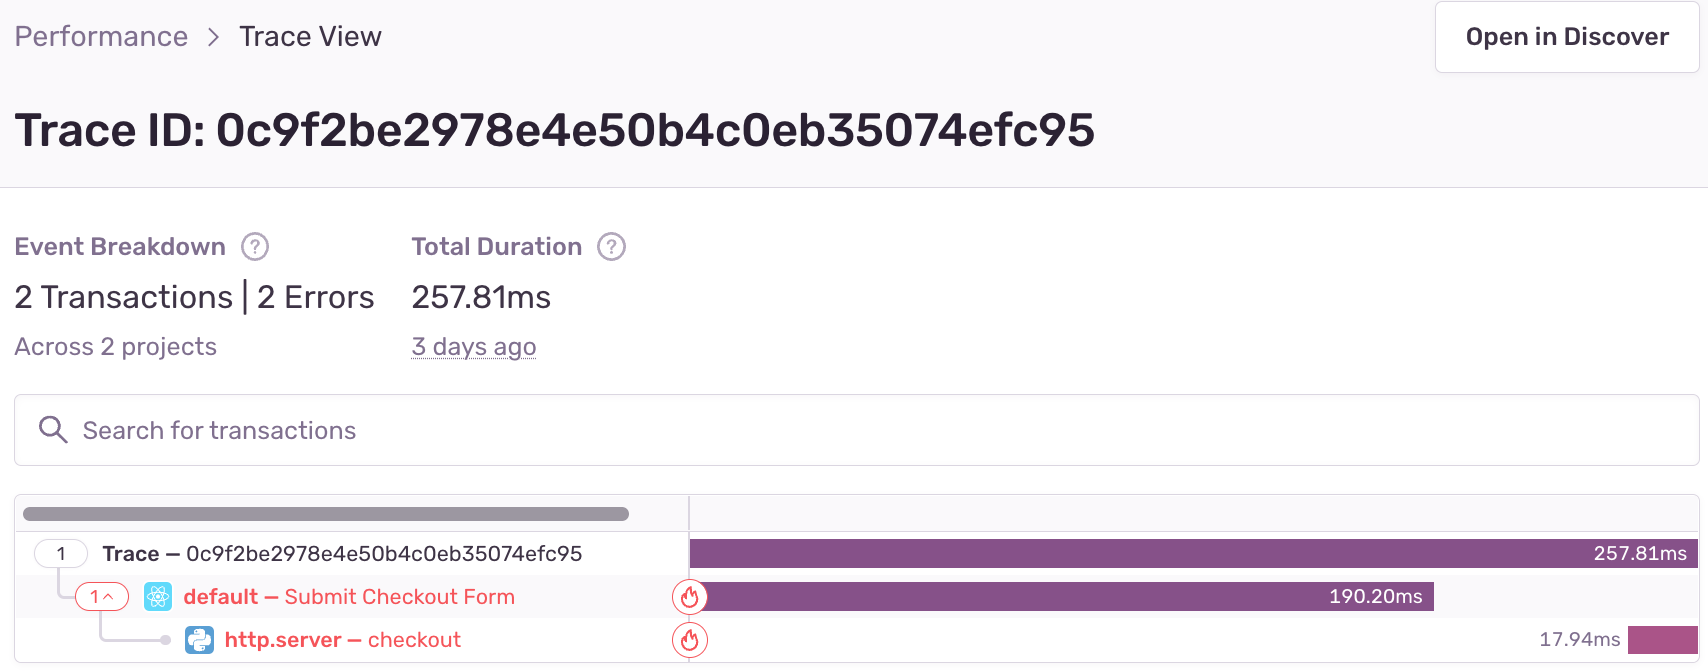
Instead, by monitoring our frontend and backend, we’re able to see where issues originate, how they’re related, and any additional unexpected side effects. Speaking of side effects. From Trace Navigator you can select full trace to… view the full trace. With Trace View, you can follow the trace from the frontend to the API call on the backend and get the duration of every transaction.
Faster (est) time-to-resolution
So.. what, right? Navigating issues in your product or service shouldn’t require a PhD. Trace Navigator and Trace View quickly identify whether a frontend issue is related to a problem deeper in your stack. By addressing issues in only one part of your codebase, you risk wasting your time solving symptoms of a problem when the root cause is much deeper in your stack.
Sentry supports more than 100 languages and frameworks. No matter what you’re building or what you’re building in, Sentry can monitor the changes in your code and give you the full context that you and your team need to solve what’s urgent faster.
For questions or feedback about Trace Navigator or Trace View, drop us a line on GitHub, Twitter, or our Discord. And if you’re new to Sentry, you can try it for free today or request a demo to get started.


