Unity Performance Testing Tools & Benchmarks
Unity Performance Testing Tools & BenchmarksThe following guest post addresses how to improve your services’ performance with Sentry and other application profilers for Unity. Learn more about Sentry's Profiling product or try it out now if you're already a Sentry user. We’re making intentional investments in performance monitoring to give relevant context to help you solve what’s urgent faster.
Application profilers augment performance data by capturing every function call in a given operation. You can quickly find the exact functions causing slow app starts, jank, or anything else that leads a user to uninstall a mobile application or game. Profiling reduces troubleshooting — as you can see which device hardware, OS version, app version, or network version is causing the issue. Combined with Sentry’s Error and Performance Monitoring, developers get insights into not only what’s slow, but also the function calls that may be the root cause.
Unity is one of the most popular cross-platform game engines for creating games and other interactive applications. When it comes to Unity projects, there is massive competition in the industry to provide a smoother user experience as it is essential for user engagement and retention with the application.
The performance of an application matters most as it directly correlates with the user experience and compatibility of the application. So, this article will discuss how to run performance tests in Unity and establish benchmarks to provide a better experience for users.
Why is Performance Testing Vital?
Frames Per Second (FPS) can be considered the foundation of the gaming experience as the human eye can rapidly perceive changes in visual details.
If the game renders slower, it feels laggy, and no matter how advanced your game is, players will probably get bored of it.
On the other hand, just like in software development, Unity applications should also focus on a wider audience, supporting various devices and operating systems. Therefore, as a Unity developer, you must clearly assess the ability to perform seamlessly on multiple device types.
Getting Started with Performance Testing in Unity
Performance testing in Unity can be carried out in multiple ways, varying from built-in tools to Unity editor to third-party cloud solutions. Let's explore a few basic tools and a state-of-the-art solution to extend performance testing using distributed tracing tools below.
1. Unity Test Framework
The Unity Test Framework (a.k.a Unity Test Runner) allows you to carry out cross-platform tests supporting Android, iOS, and standalone applications. This framework is embedded in the Unity editor, and you do not need to install additional packages from outside.
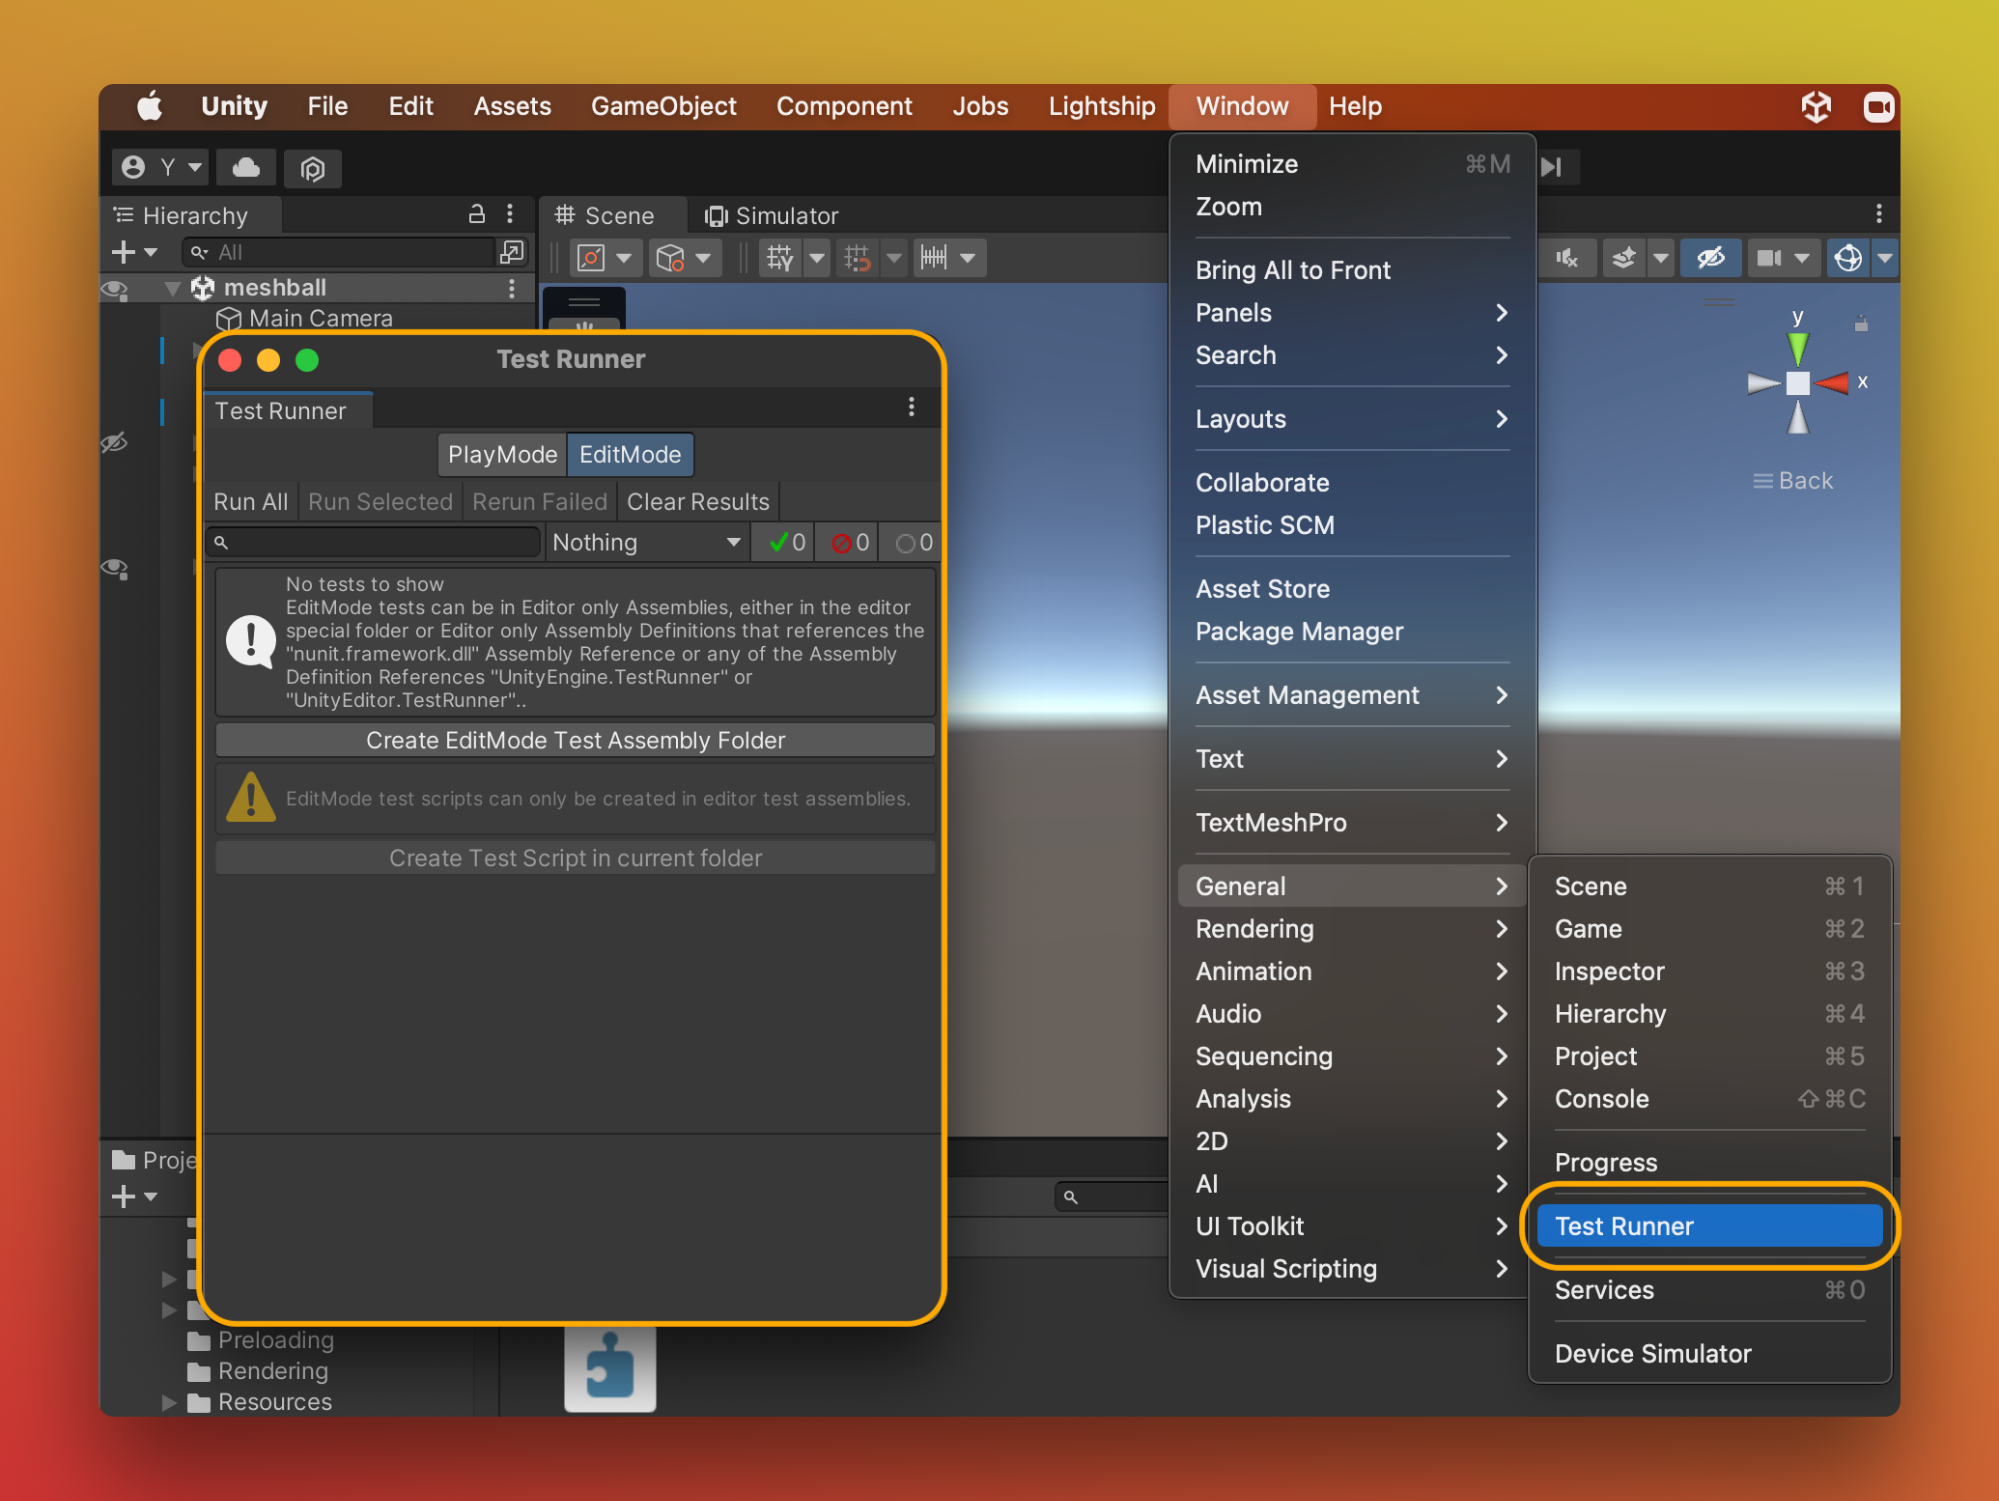
You can go to Window --> General --> Test Runner to open the Test Runner window.
Unity Test Runner allows developers to test their applications under "Play Mode" or "Edit Mode." Furthermore, you can use this on a target platform such as Android or iOS.
You can write unit test cases using the NUnit library by initializing Test Runner. Below is a sample test case in NUnit.
[Test]
public void GameObject_CreatedWithGiven_Name() {
var gameObject = new GameObject("Ball");
Assert.AreEqual(“Ball”, gameObject.name);
}Once you have tests in place, Test Runner Window will show all the test cases, and you can run those quickly. However, it needs more developer effort to write test cases. ON the other hand, it helps to identify potential bugs and performance issues in your Unity project. You can refer to Unity Test Runner Documentation for more details.
2. Performance Testing Extension
The Performance Testing Extension package primarily focuses on the performance metrics of Unity applications based on the previously discussed Unity Test Runner.
To install this package, you need to follow a few steps, such as adding a few code lines to manifest.json of your Unity project and creating a new assembly definition. You can find the complete step-by-step guide here.
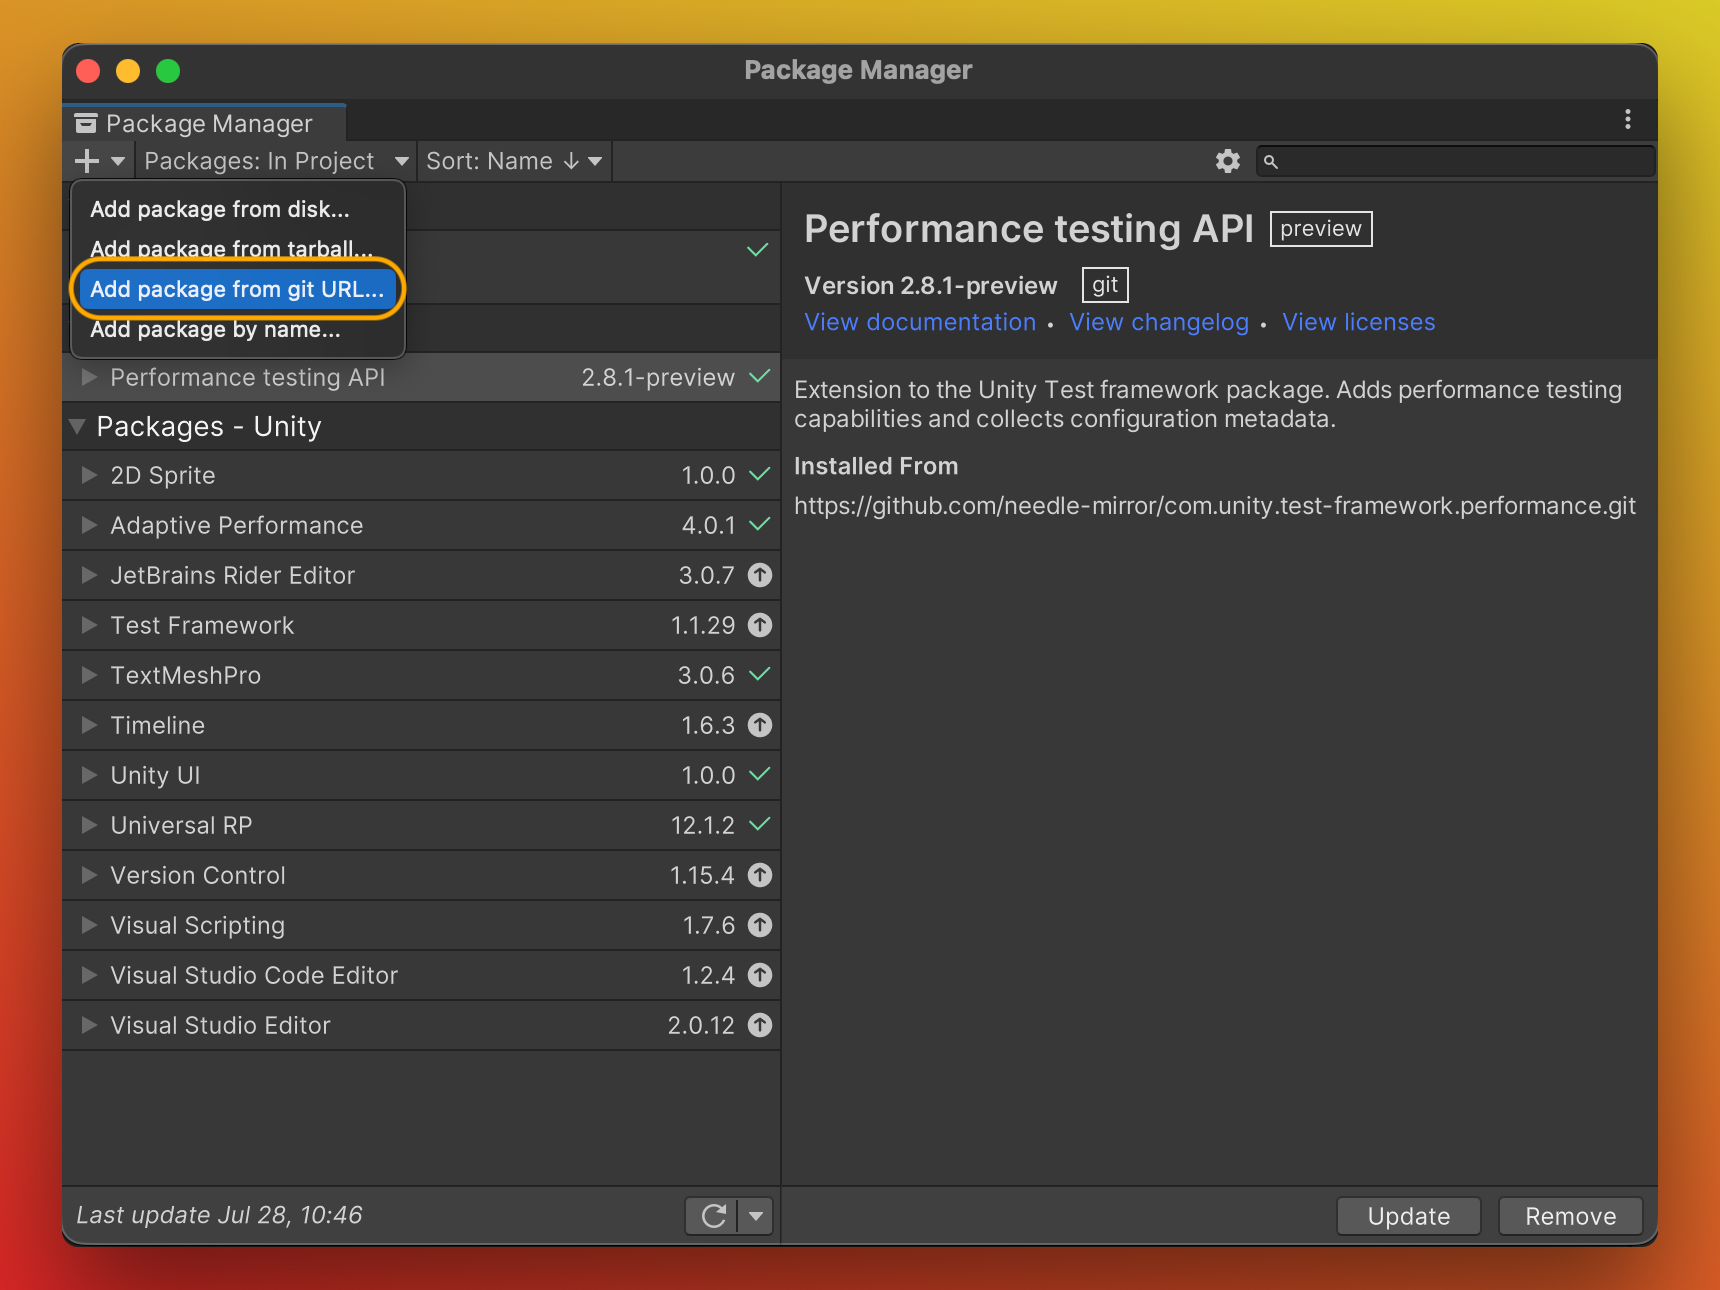
However, I prefer to use Unity Package Manager to fetch the com.unity.test-framework.performance as shown below.
After fetching the package to the project, you can create performance test cases related to your project through Unity Test Runner Window. Below is a simple performance test case for your reference.
using NUnit.Framework;
using Unity.PerformanceTesting;
using UnityEngine;

public class PerformanceTest : MonoBehaviour
{
    [Test, Performance]
    public void Test()
    {
        Measure.Method(Counter).Run();
    }

    private static void Counter()
    {
        var sum = 0;
        for (var i = 0; i < 10000000; i++)
        {
            sum += i*3/3;
        }
    }
}
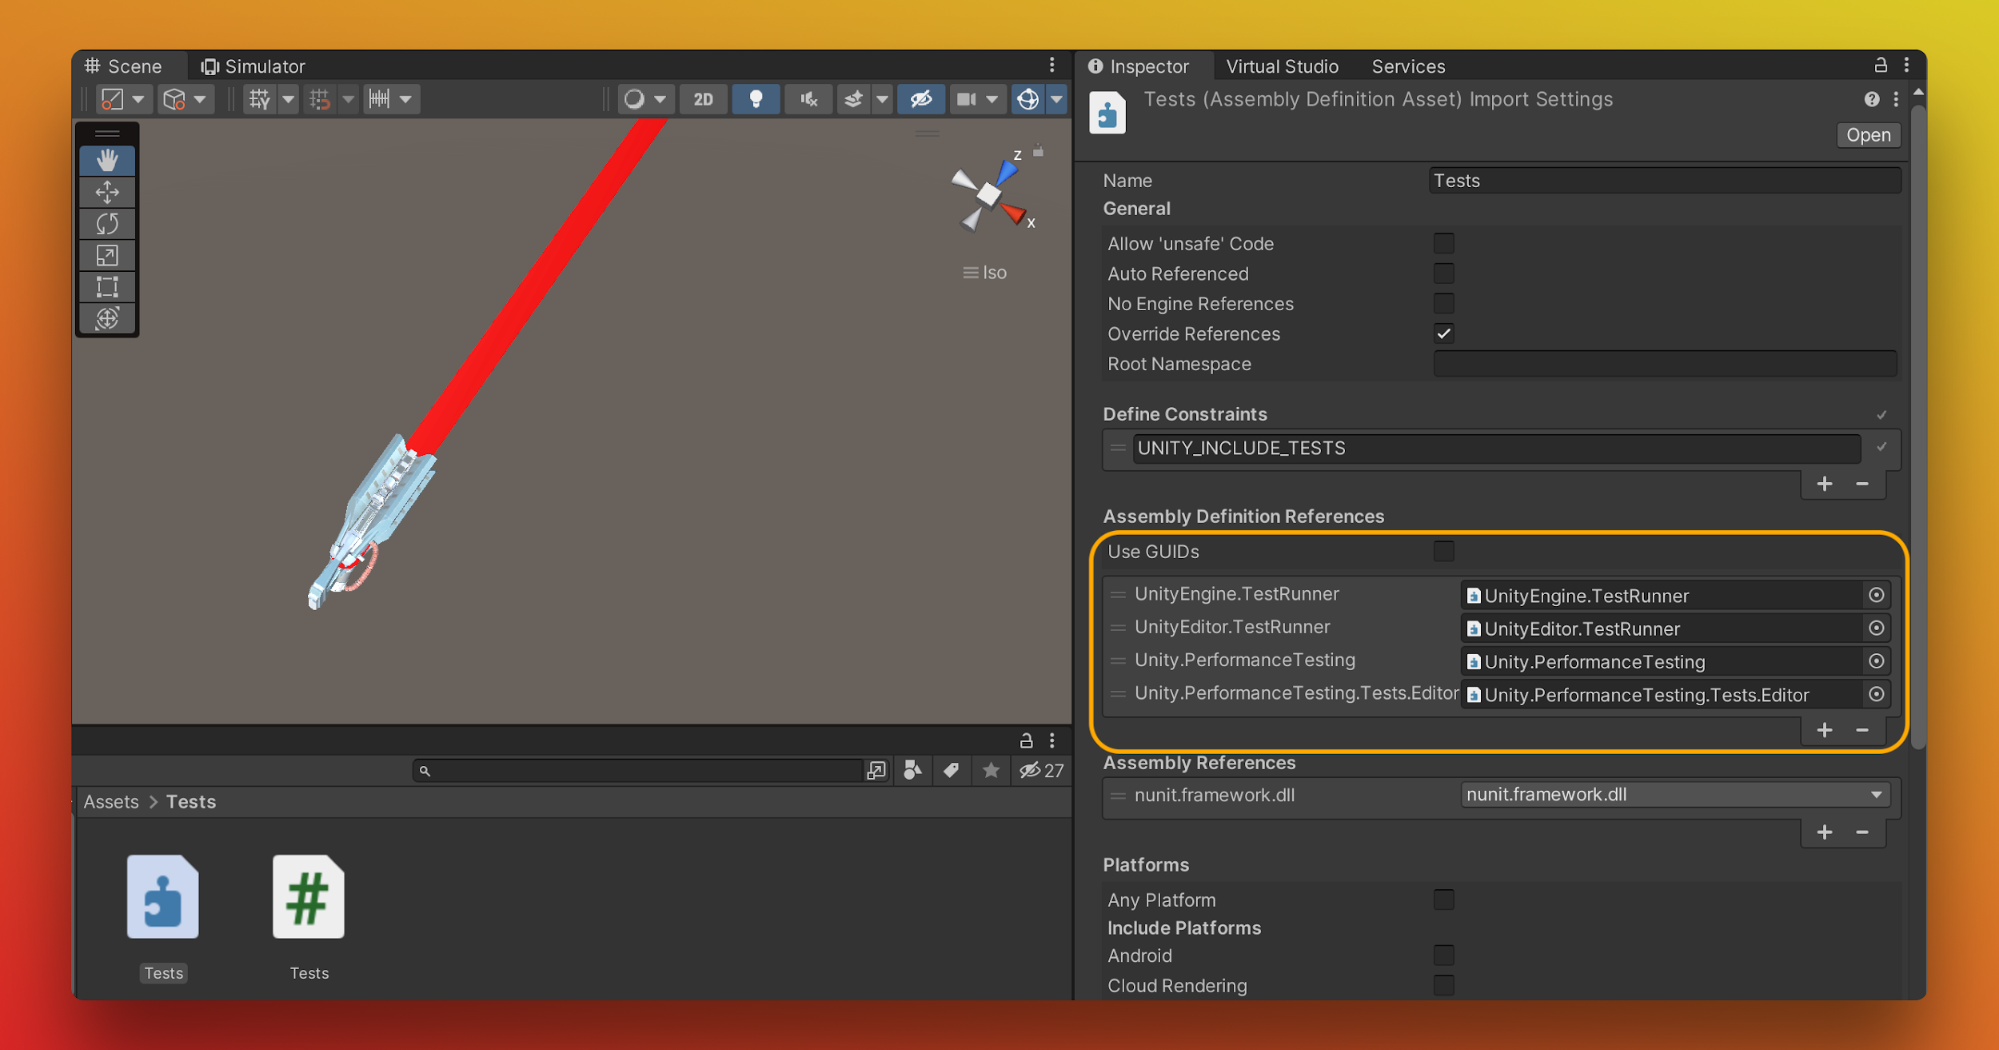
Make sure to set both TestRunner as well as PerformanceTesting assembly definitions through the inspector panel.
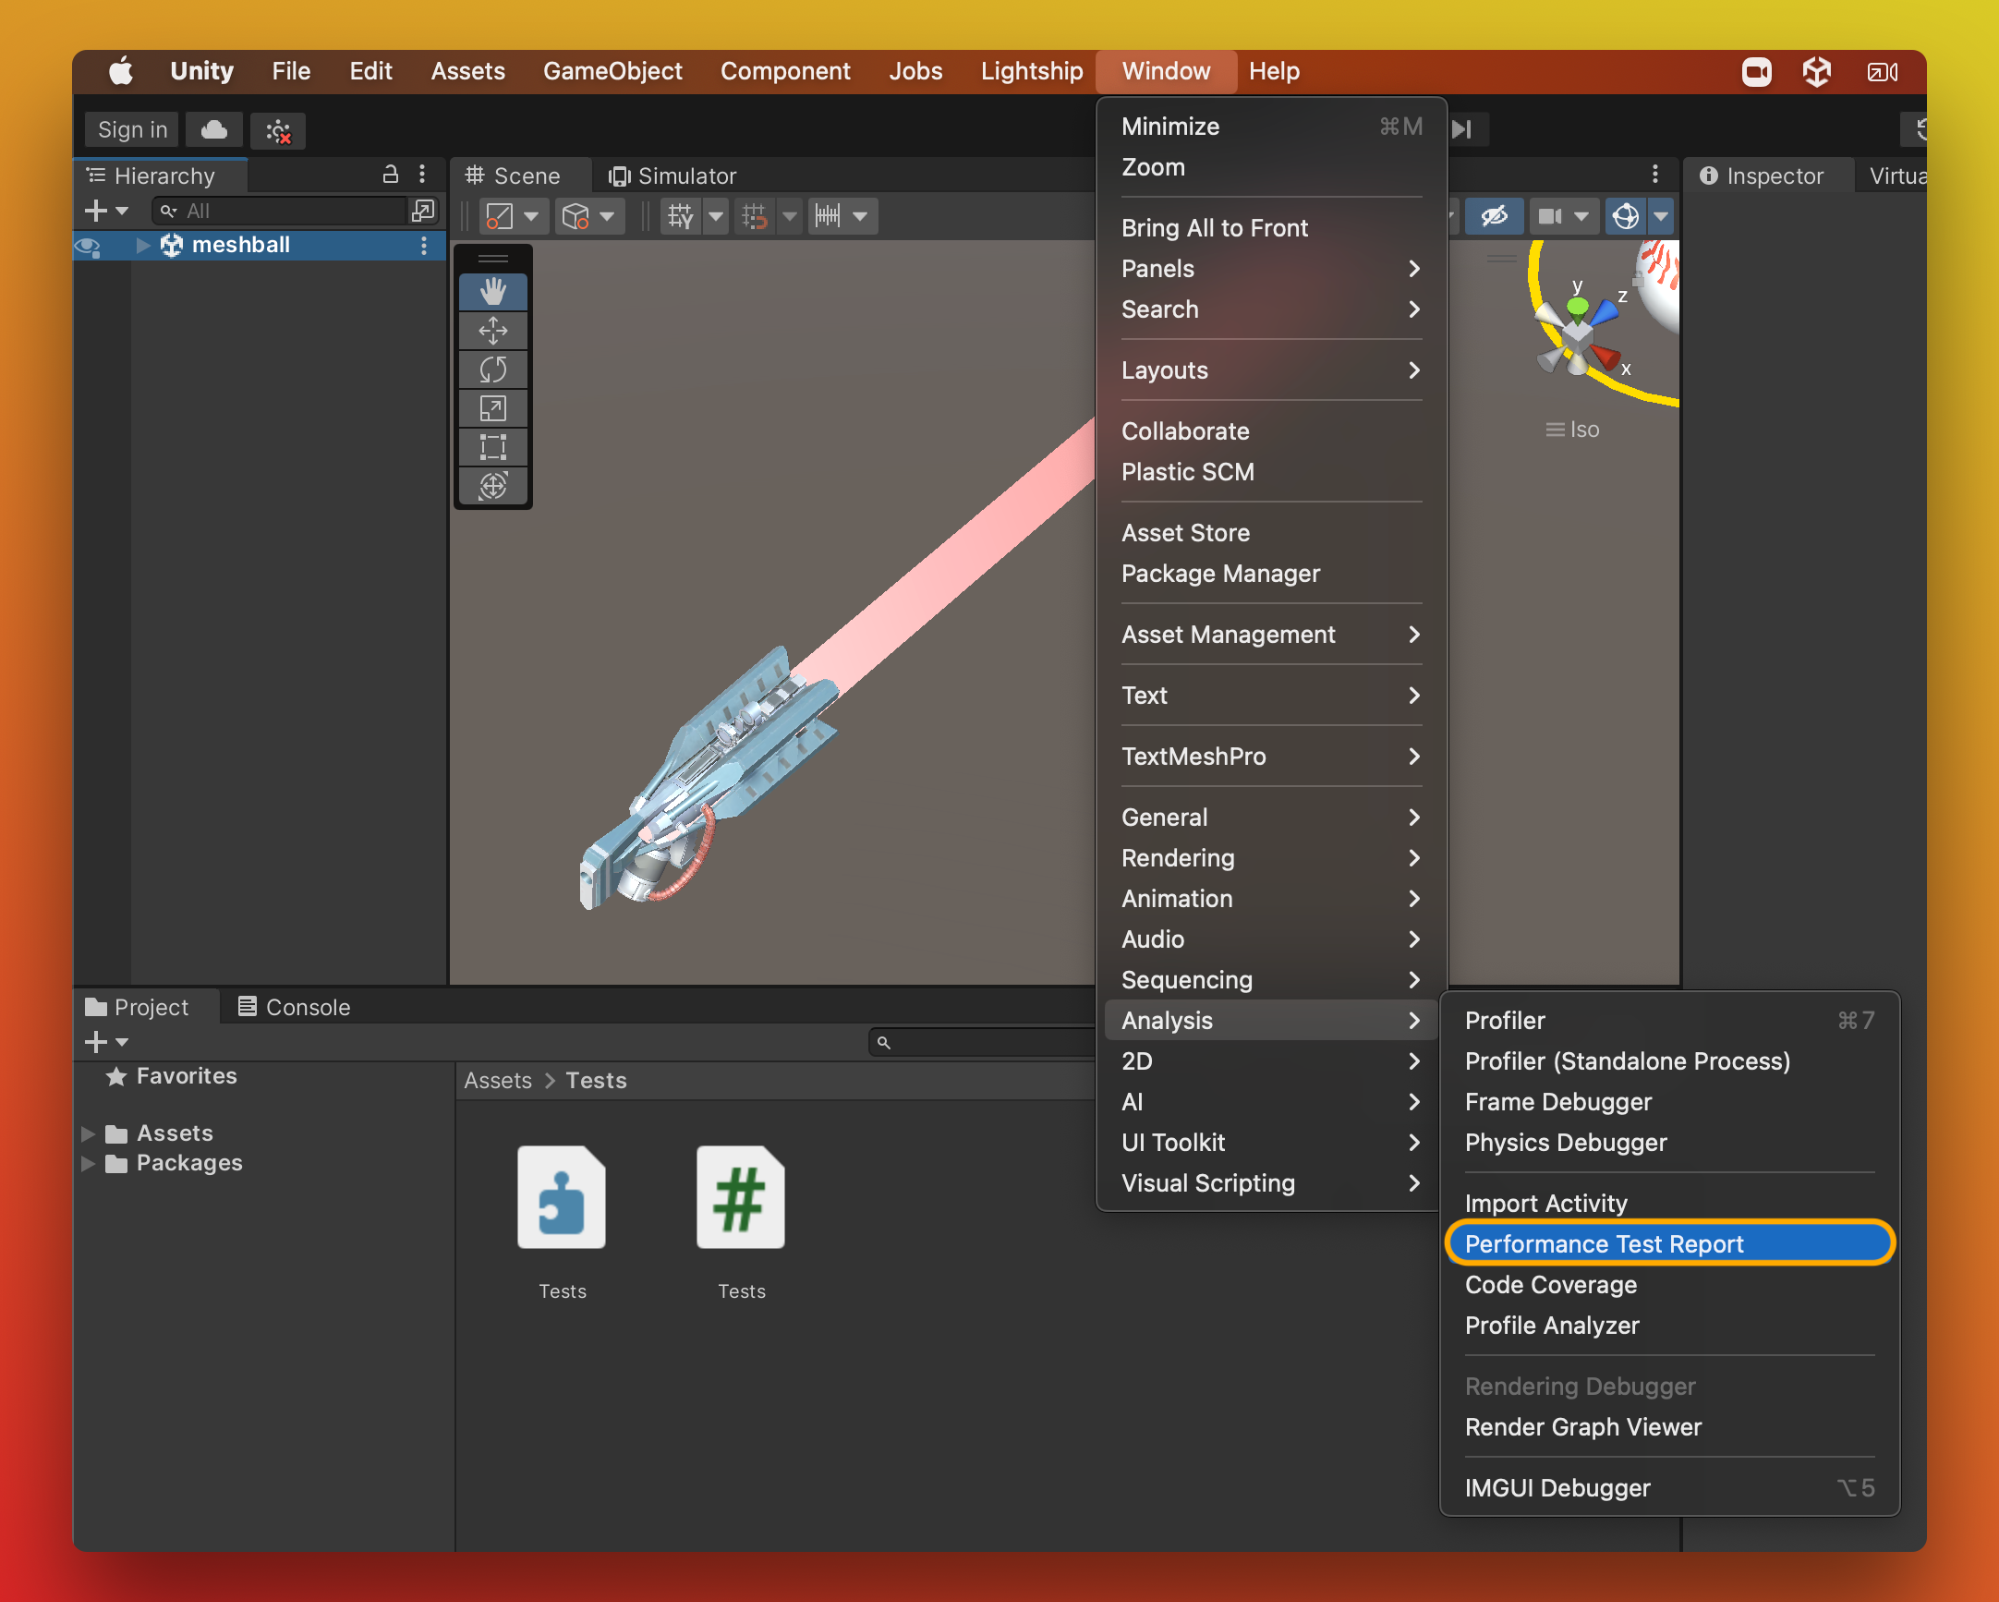
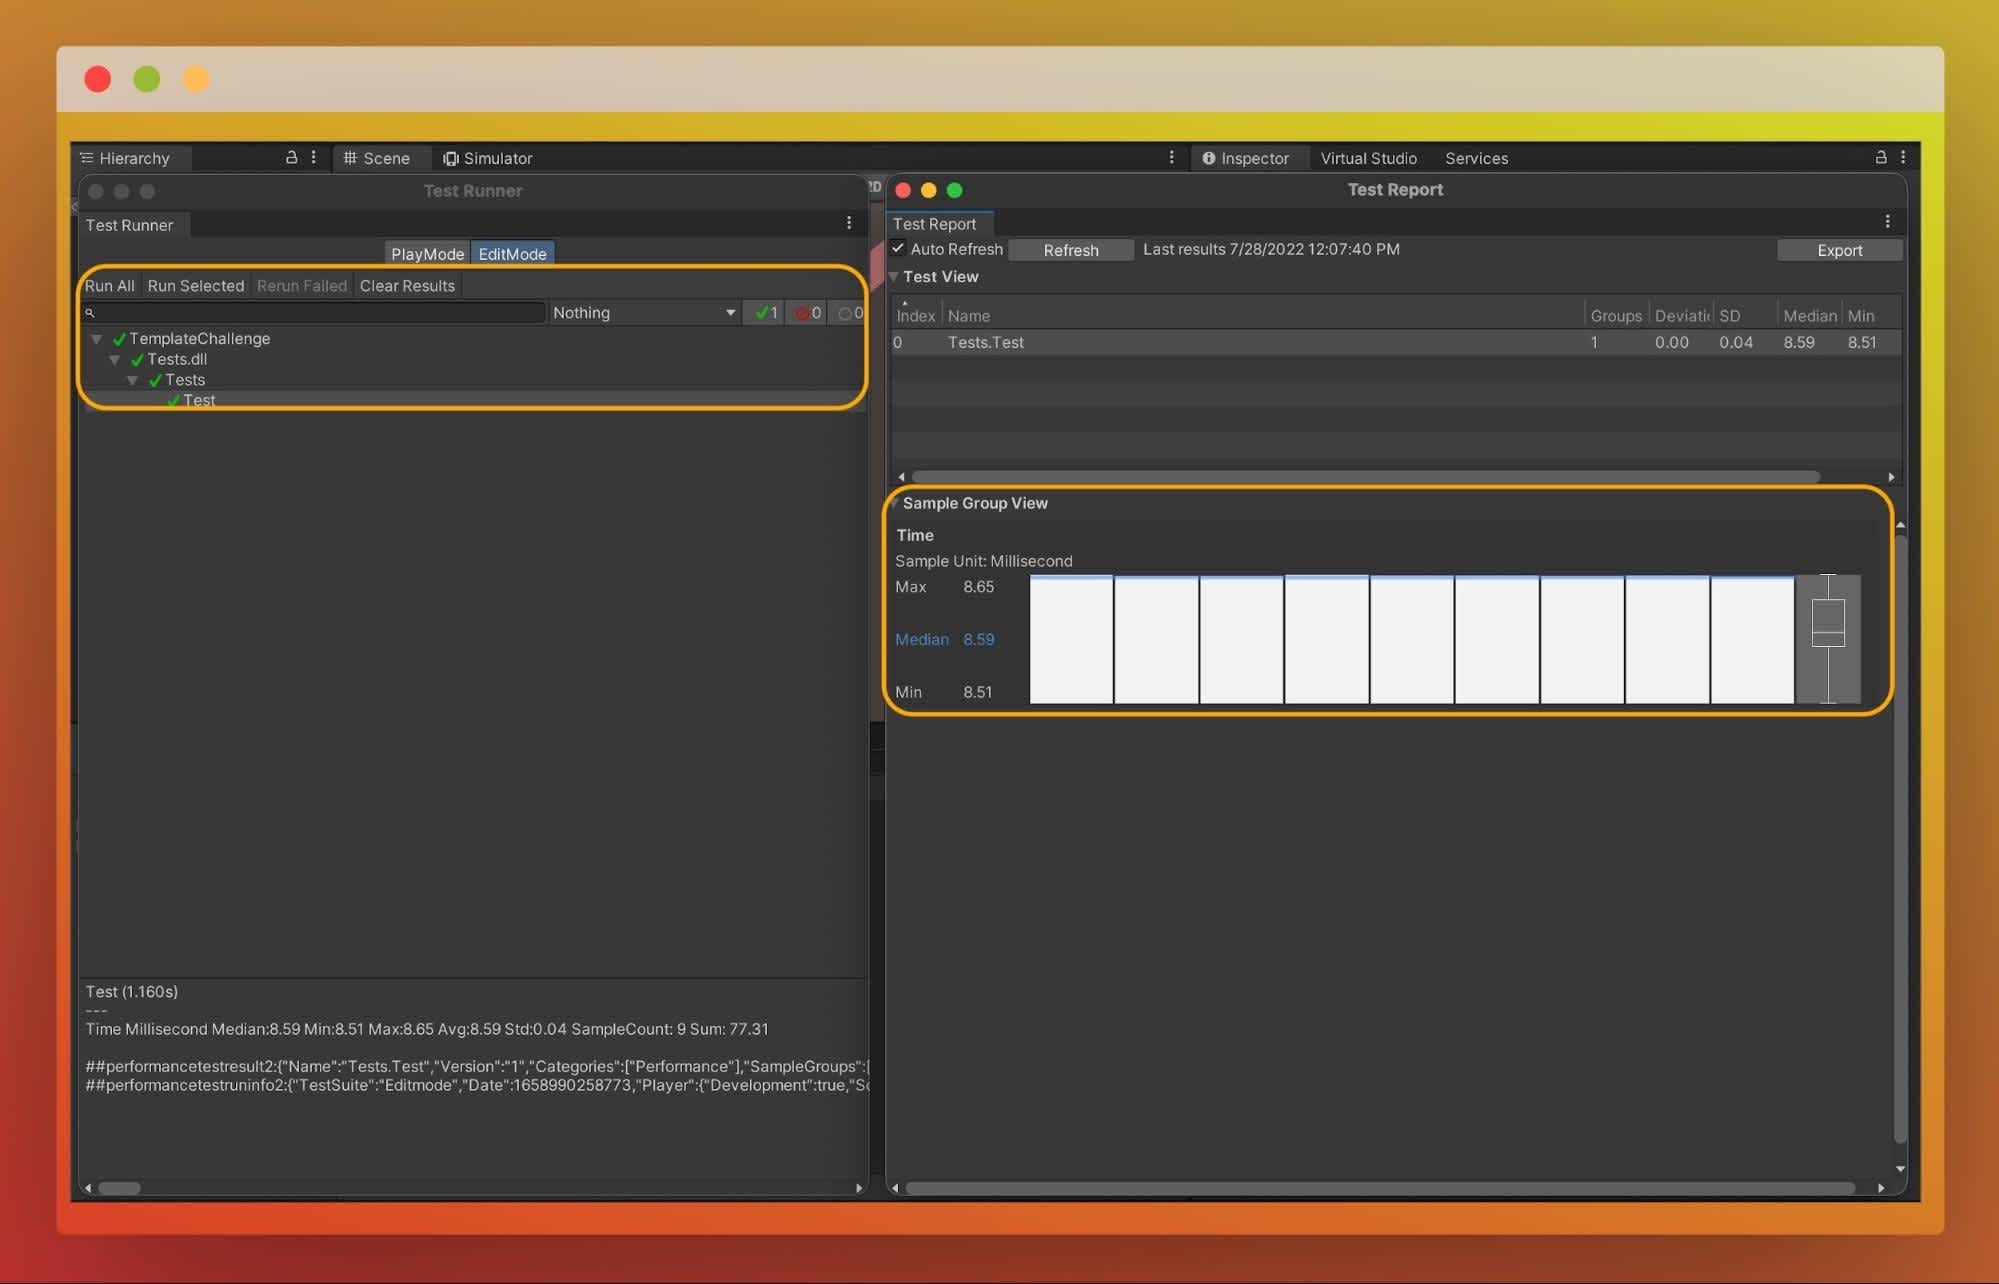
Next, you can go to Window --> Analysis --> Performance Test Report to open the Performance Test Report window.
Finally, you can execute your tests using Unity Test Runner and check the Test Report.
As Unity developers, the Test Report helps to understand the time taken to render your game implementation visually and game logic, sampling the text execution times as shown above.
3. Unity Profiler
The Unity Profiler is a powerful tool within the Unity editor. But it is mostly underrated among developers. This tool gives in-detail game performance metrics, including frame rate, memory usage, rendering statistics, and many more.
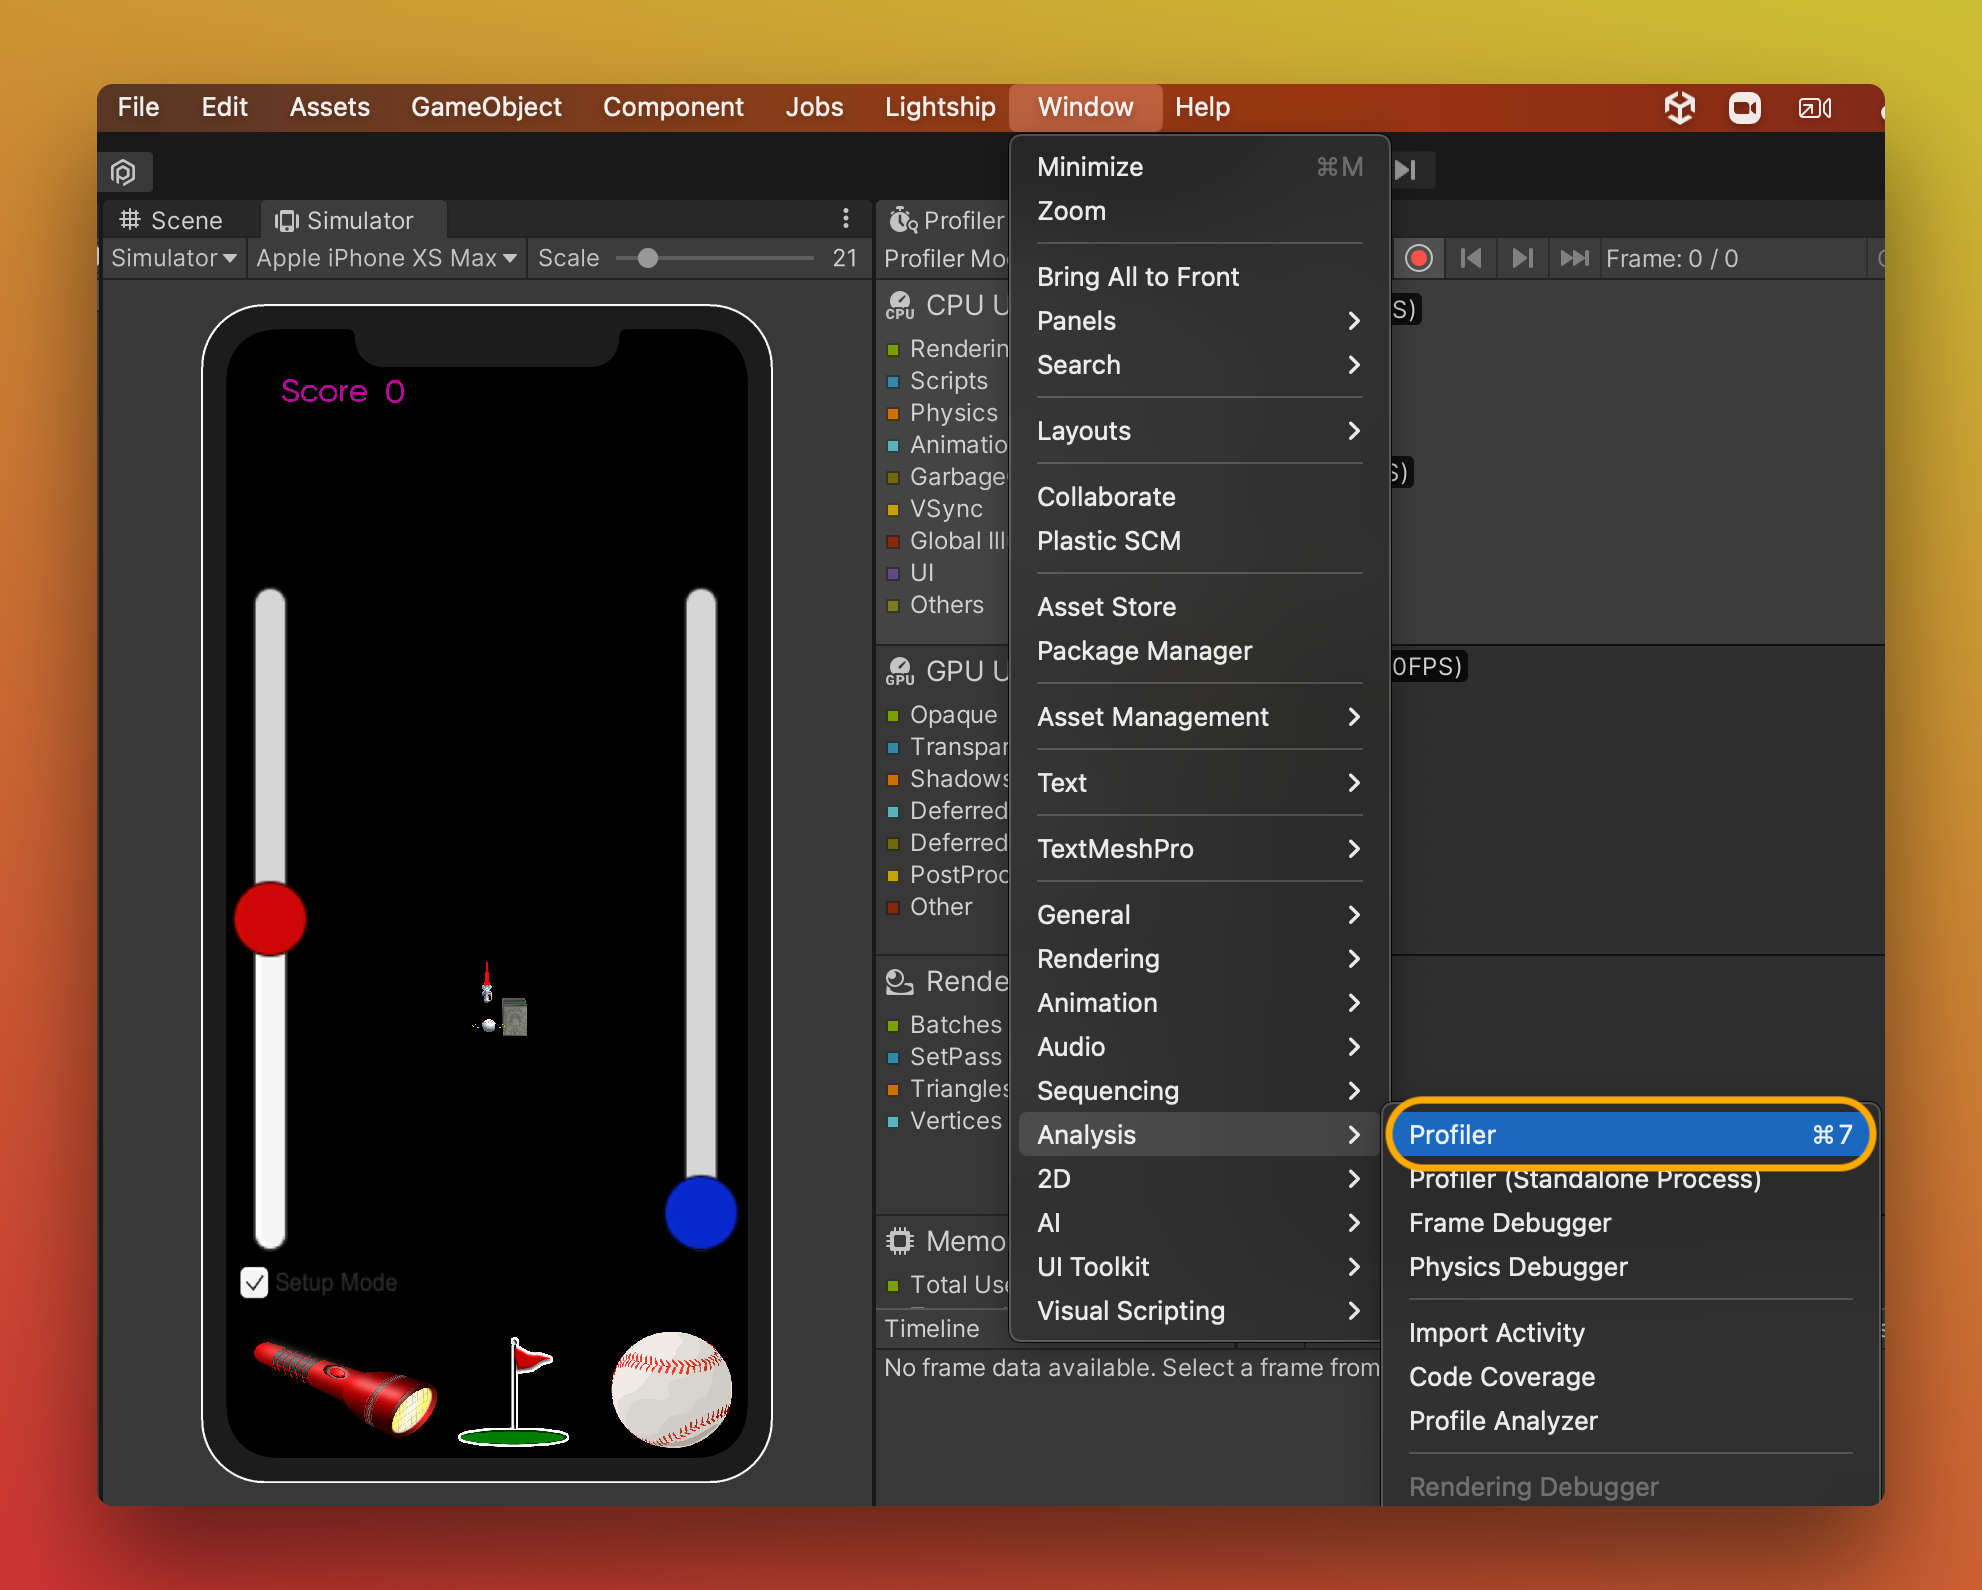
You can open Unity Profiler through Window --> Analysis --> Profiler menu.
Unity Profiler is a very straightforward tool to use. You just need to run your Unity project within the editor and inspect the Profiler window. You will be able to see performance data on the Profiler, and if you want, you can record them to analyze later.
Unity Profiler can be attached to connected devices to your machine and measure the performance aspects of the application on the intended runtime environment. You can check more about Unity Profiler in the Unity Manual.
If you feel a performance bottleneck in your game or the players complain, you can play the game with Profiler turned on. Then, you can refer to the analytics in real-time while progressing through the game. It helps you identify at which point the game causes issues and what performance-intensive game elements and interactions you need to focus on to optimize the game.
4. Performance Monitoring with Sentry
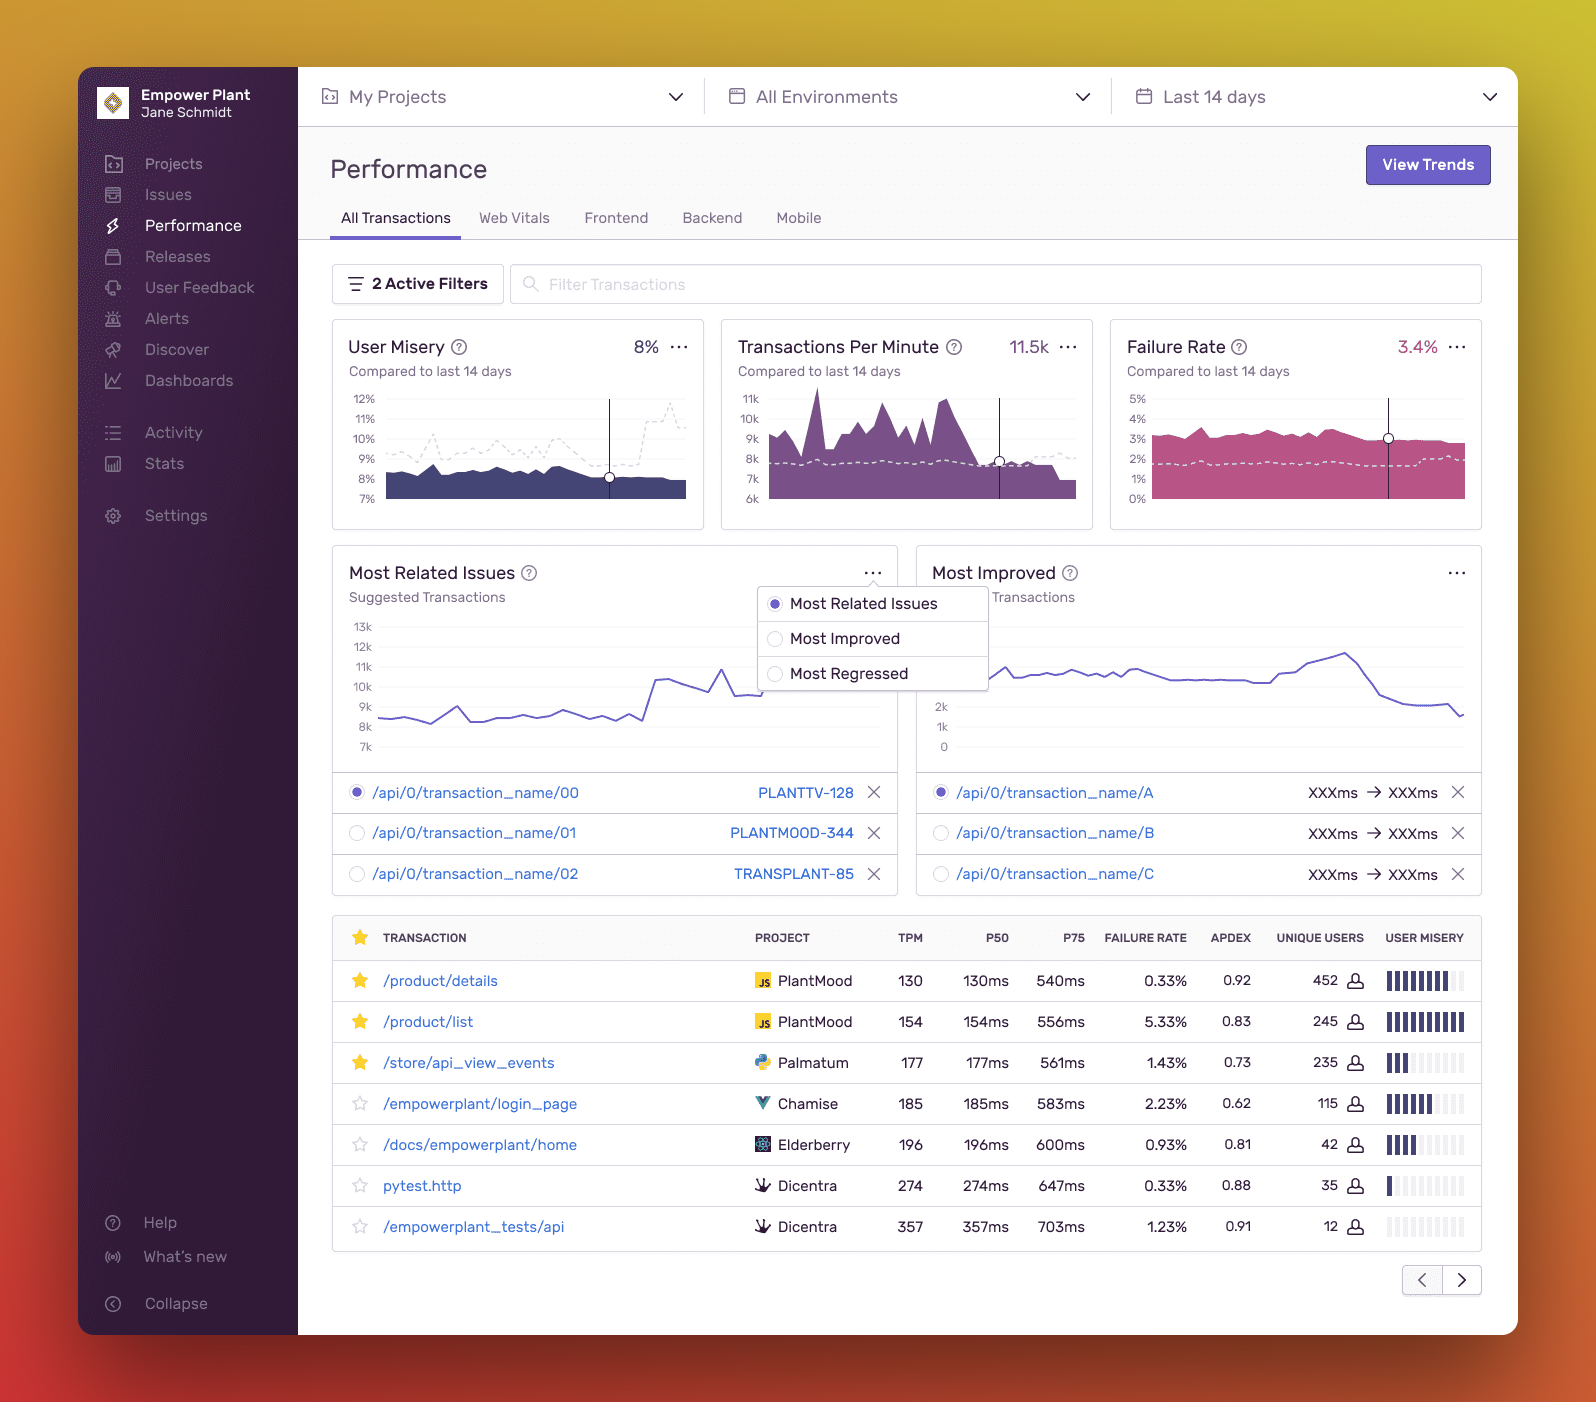
Sentry provides distributed performance monitoring in a user-friendly dashboard for Unity development. Unlike other performance tracking tools, Sentry makes your developer life much easier by delivering actionable performance insights such as throughput, latency, the impact of errors across multiple platforms, distributed traces of transactions, and more.
To get started, you'll have to create an account and configure a project on Sentry. Afterward, install the Sentry SDK for your Unity application via the Unity Package Manager using the git URL below.
https://github.com/getsentry/unity.git#0.9.1
Next, there are two steps for you to configure Sentry for performance monitoring.
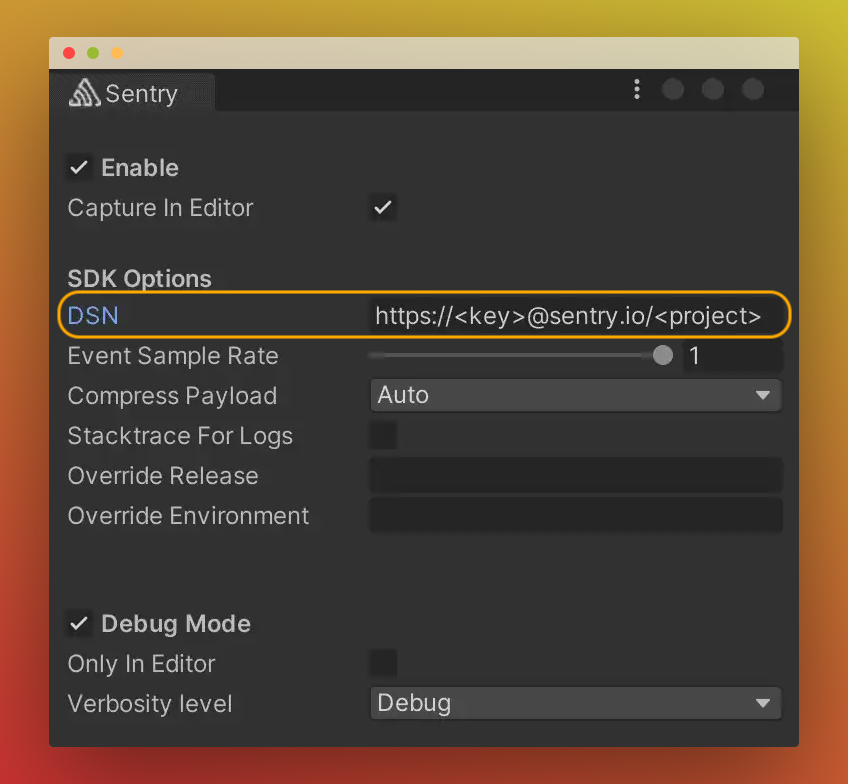
The sentry configuration window is the easiest way to configure Sentry in your Unity project for basic needs. You can go to Unity's top menu: Tools --> Sentry to open the configuration window.
Upon creating an account, you will be given a "DSN value." You can automatically fetch this "DSN value" from your Sentry account to the configuration window or manually copy it from the account and paste it to the relevant "DSN value" field.
Once the configurations are correct, Sentry is ready to capture statistics from your Unity application.
Sentry provides native platform support covering Android and iOS to track application events such as app crashes and capture exceptions and messages. Once you have the Sentry package installed in your Unity project, you can tweak it further by referring to Unity Guides on Sentry to enable advanced services as required.
Establishing Performance Benchmarks
In Unity projects, there are a couple of essential metrics.
Frame Rate
Frame rate is a standard measurement to evaluate performance. This is measured in Frames Per Seconds (FPS) values. Generally, the benchmark value for a god game is 30 FPS. But, modern games usually deliver 60 FPS. So the more FPS value your Unity project can provide, the better it is in many aspects.
Note: If you are building VR applications, the FPS value should be at least 90 or above to deliver better immersion to players.
CPU Usage
This metric is directly coupled with the FPS rate. If you notice a lack of FPS rate, you must check CPU Usage. Using your preferred Performance Monitoring Tool, you can check what tasks of your Unity projects occupy the majority of your CPU Usage. Over usage of CPU may even cause device overheating, application lagging, or even crashing.
GPU Usage
If your Unity project is more GPU bounded, this is another criteria you need to focus on. Not all devices and projects support GPU profiling, but if your one does, you need to maintain healthy GPU usage throughout the game. Setting up GPU threshold values depending on your requirements is essential because it directly affects the user experience and compatibility of the application.
Depending on the nature of your Unity project, there can be more benchmarks to focus on. You need to spend some time during the requirement analysis stage to determine what those are and the estimated threshold values of each.
How Frequently Should You Test?
Continuous Integration (CI) is not a new activity in software development. But, developers are still not giving much attention to CI when it comes to Unity projects. However, setting up a proper CI pipeline while automating Unity tests is essential.
You can establish an automated testing phase using any CI tool such as Bamboo, Jenkins, or Unity Cloud Build. Those performance test suits must execute and validate against the predefined threshold values to ensure your builds comply with the benchmarks.
Sentry comes in handy for performance test automation due to its ease of use and alert functionality. You can set up real-time notifications to trigger customizable thresholds and integrations. For example, latency, the total number of errors, failure rate, and throughput are some performance metrics you can configure on Sentry.
In addition, you can receive instant alerts via your Slack, Microsoft Teams, or other supported platforms when things are not going as expected. It is even possible to integrate Sentry with Jira or Azure DevOps. It will automatically log performance defects detected from test execution as tickets on your project management platform so your team can triage without waiting until the end users complain.
No matter what tool you use for performance testing, you need to ensure you run your test suites every time you perform a code change, preferably triggered automatically for your every commit.

