Get Insights Into Project Health with Updates to Dashboards and Stats
Get Insights Into Project Health with Updates to Dashboards and Stats
Between planning, triaging tickets, negotiating requirements with external stakeholders, and actually building software, it's hard to take the time to make dashboards or even think about the most important metrics your team needs to track.
To make it easier for you to get insights into your team effectiveness and project health, we made a few updates to Dashboards and Stats that you just might like. These updates include out-of-the-box widgets and dashboard templates, unlocked issue data for dashboard queries, and issue stats.
Get up and running quickly with our widget library and dashboard templates
Whether you’re asking, “What are the most critical issues to review?” or, “What are the top page load times by country?”, we want you to get the answers to your questions quickly—without having to even think about it.
We compiled some of the most popular queries into pre-built widgets that you can add to your customized dashboard. You can change the title, queries, fields, visualization types, and sort the order of each widget to suit your use case.
Plus, with our newest dashboard layout options, you can update your widget's height, width, and location to customize your dashboards for any screen or scenario. That way, you can highlight the insights you want your boss to see and downplay the rest.
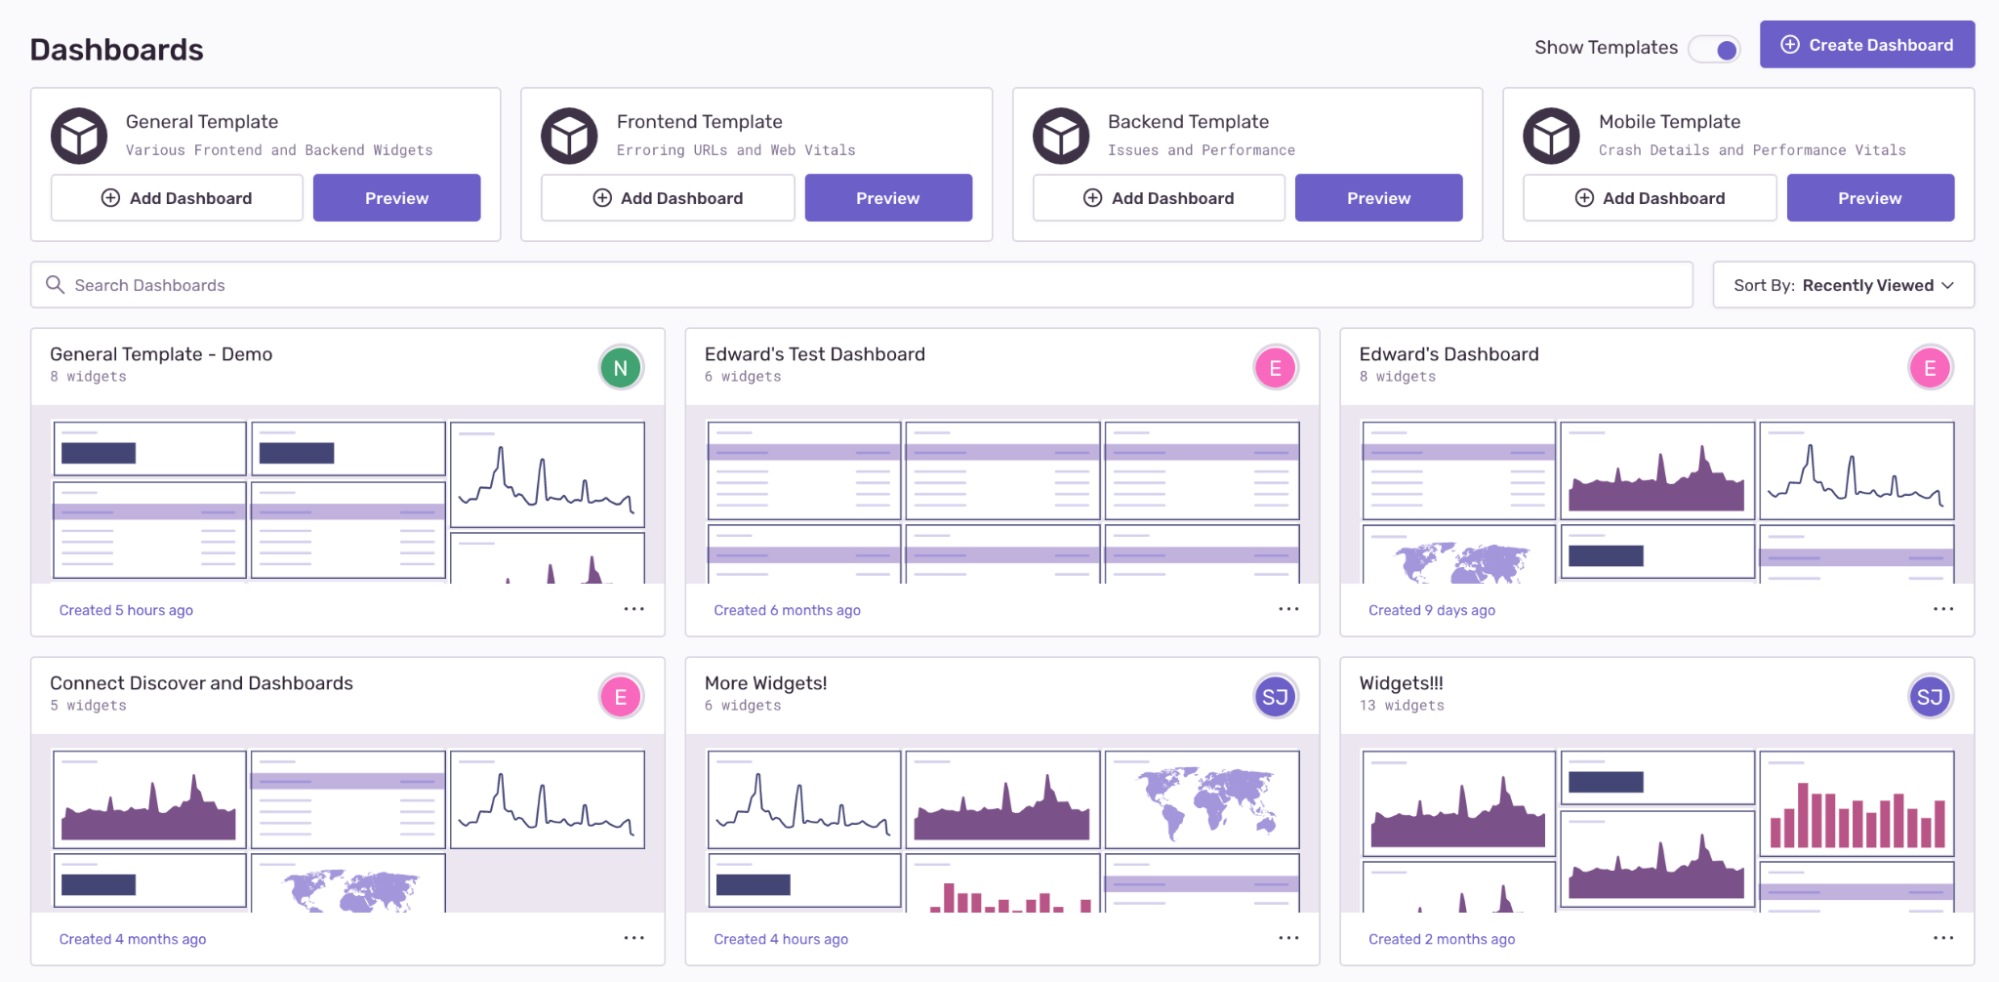
Continuing with the theme of not making you think, here’s a catalog of custom dashboard templates for your mobile, frontend, and backend projects so that you can get project-specific visibility, instantly.
These dashboard templates are curated to address the needs of a specific project. For instance, the mobile dashboard template includes details such as the total number of crashes, the issues causing each crash, and total throughput—to help you understand the critical details and performance vitals related to your mobile application.
Query issue data in Dashboards
To give you deeper insight into your application health, as well as your team’s performance, we’ve added issue data in Dashboards. Now, you can build widgets to stay on top of things like the state of each issue, who it’s assigned to, and when the issue occurred.
You can display and sort by issue fields to surface the most relevant issues for your team. Or, you can sort just the ones assigned to you to help you answer questions like, “Which team has the most unresolved issues?” or, “What are the top regressed or new issues?” With issue data in Dashboards, you’ll get the important context of a problem in your application, making it easier to prioritize and manage your workflow.
Measure team effectiveness with issue stats
Open issues often live in different places and are worked on by different teams, making it difficult to keep track of team progress.
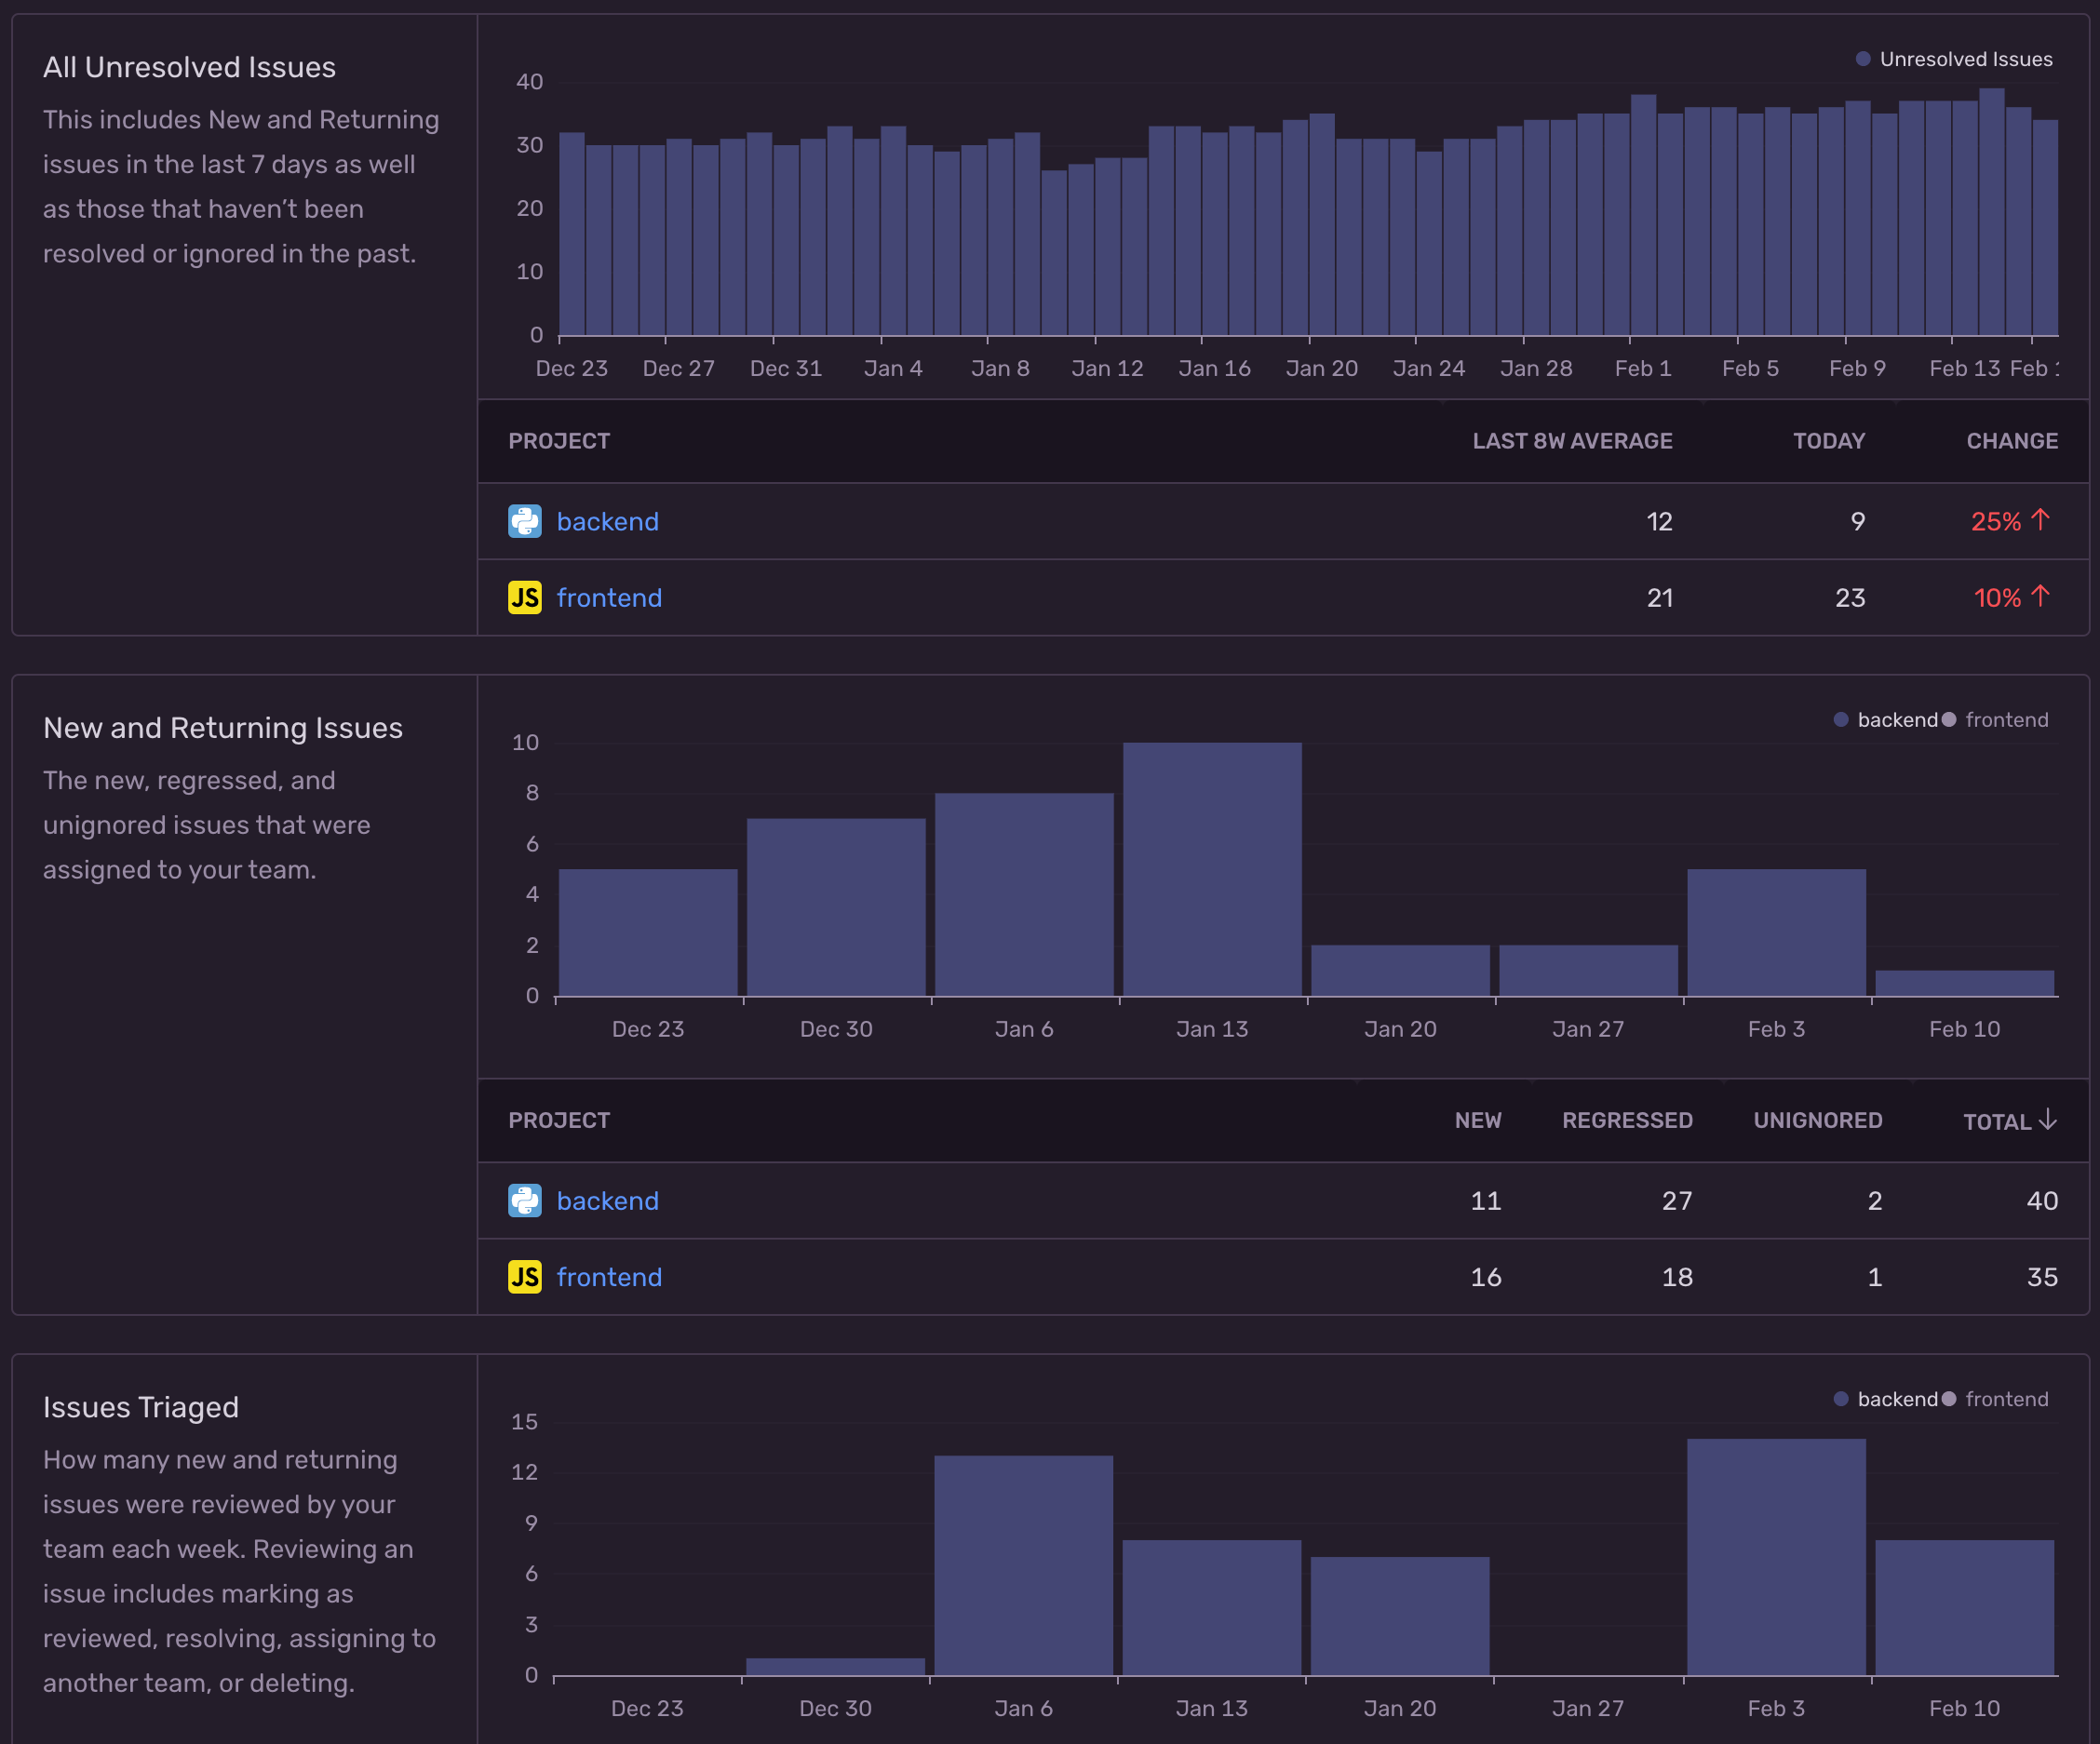
Issue stats lets you see developer velocity. It also helps you uncover potential bottlenecks with a view into things like the number of new issues that happened this week, how that affected the backlog of unresolved issues, and which issues your team resolved. If you see something unexpected and have more questions, you can use Discover—and now, Dashboards —to spelunk further.
With pre-built widgets, dashboard templates, and issue data in Dashboards and Stats, we’re making it easier than ever to get insights into team and project health. Spend less time manually building reports and more time learning about your application and team’s performance, so you and your team can build better, faster.
If you currently use Sentry and are a Business Plan customer, sign in to use these features today. New to Sentry and want to learn more? Request a demo or check out our latest webinar to see it all in action.


