Use Suspect Tags to improve App Performance
Use Suspect Tags to improve App Performance

When you’re optimizing your application for performance, it helps to understand the user conditions where the slowest transactions occurred, such as OS, browser type, and even connection type. However, with performance data, it can be hard to see the forest through the trees. Suspect Tags make it easier to find specific performance issues, rule out user conditions outside your control, and in general, have a better grasp of performance within your application.
We use Suspect Tags to find slow requests in Sentry. For our frontend project, we wanted to improve LCP to speed up our users’ experience. Adding tags makes it easy to find and visualize performance groups within transactions — you can compare performance without the noise.
To do that, we wanted to focus on the slowest transactions. Once you click on the transactions, you’ll see an overview page with a list of suspect tags. By default, they are sorted by total time lost, helping us quickly shortlist suspicious tags.
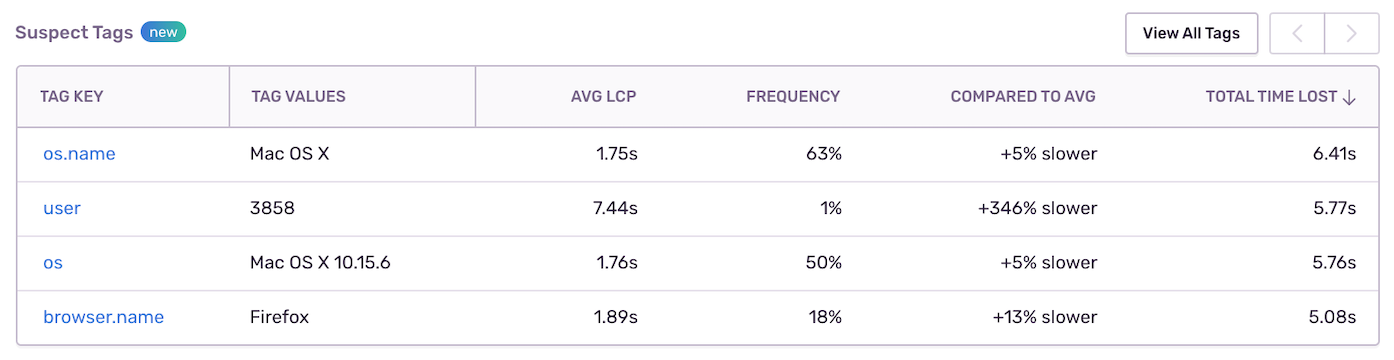
Here, we’re looking at tags affecting the largest segment of users. We usually use multiple tags on top of the default ones, such as the user’s effective connection type, filtering out users on older 3G networks or hardware that is no longer supported.
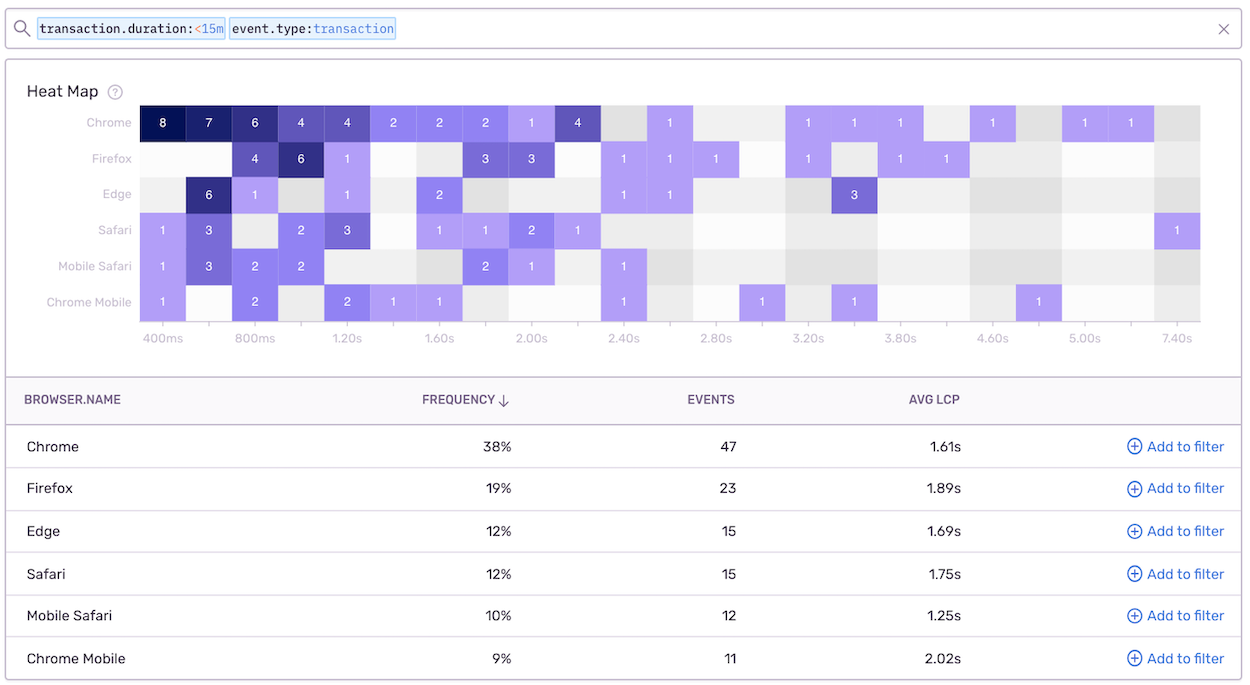
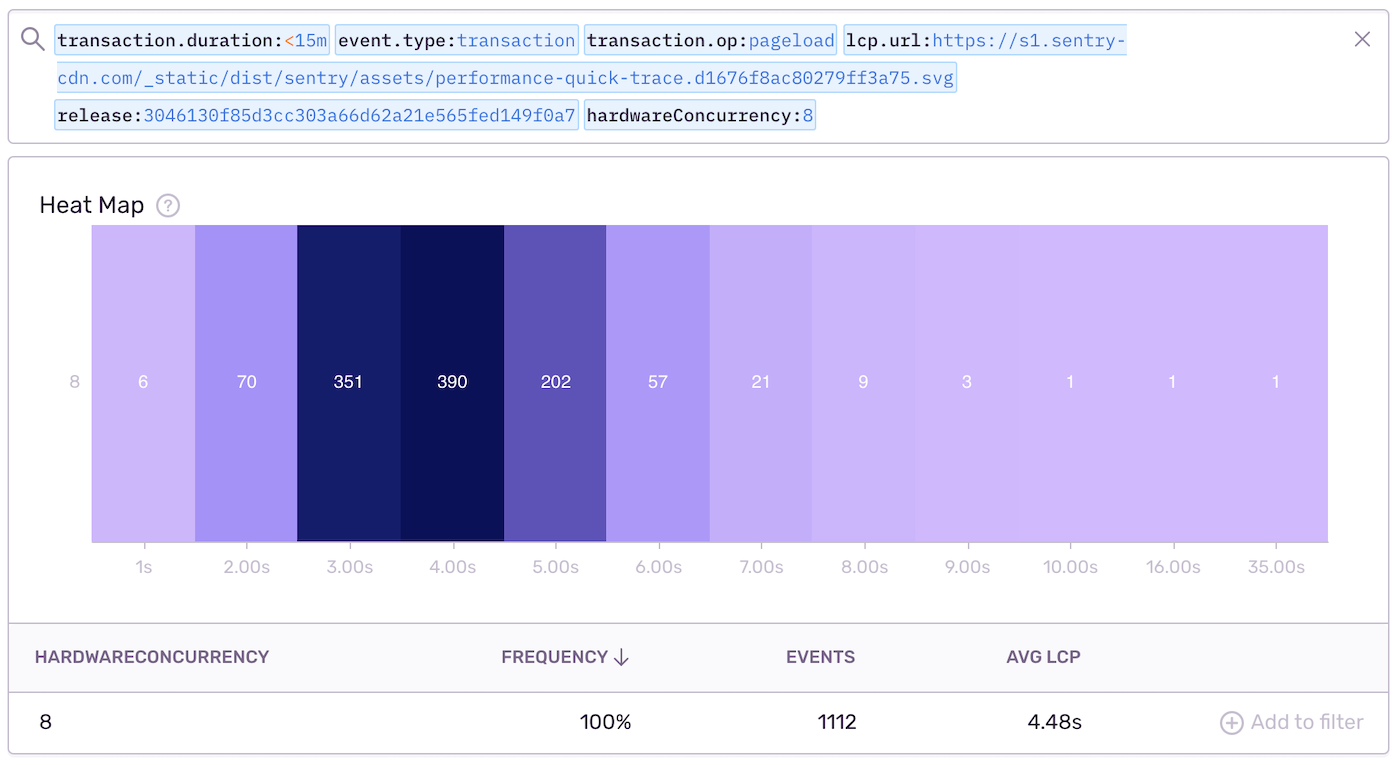
To give you more control when narrowing down transactions, we’ll select filters that correspond to a majority of users. We might also filter out users with the Edge browser since that’s not our typical use case. By eliminating conditions like hardware or battery level, we can focus on conditions that affect our key user base. Once you select the Tags tab, you’ll see a heatmap, filtered by the list of suspect tags.
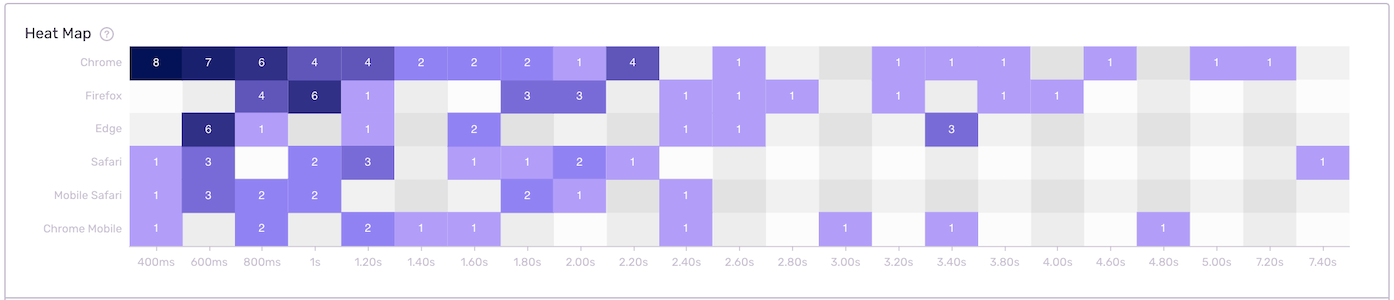
This heatmap shows a list of user conditions and corresponding performance behavior. You can refine the heatmap by changing transaction duration bounds in the filter (eg. transaction.duration:<15m). Now, just click on a purple box to isolate and add filters based on different suspect tags to create your custom heatmap.
Suspect Tags helps you find the issues that affect your customers the most, giving you a clear signal on what broke and how to fix it efficiently.
Next Steps:
First, watch a demo of this feature from the developer that built it, watch this video.
Next, start using suspect tags to find latency issues in your app with Sentry Performance.
Try Sentry for free today or contact us at sales@sentry.io to get started.


