Using server-side caching to speed up your applications, save on infra costs, and deliver better UX
Using server-side caching to speed up your applications, save on infra costs, and deliver better UX
If you’ve ever been floored by a sub-100ms response time, you’ve likely got caching to thank. Caching is the unsung hero of performance, shaving precious milliseconds off your application’s response time by storing frequently accessed data, avoiding yet another round-trip request to the database or API.
Let’s break down how caching works and explore a few common strategies.
What is caching, and how does it work?
Caching is essentially short-term memory for your data in motion. At its core, a cache is a temporary storage layer that keeps your frequently accessed data ready, rather than fetching it from a slower source like a database or external API. Essentially, this is how a cache operates:
The first ask (a "cache miss"): The app checks to see if there’s data in the cache for the given key, and if there’s no data, the application performs the full, expensive operation (e.g. a database query), stores it in a cache and returns it to the user.
Fast retrievals (a "cache hit"): If there is data in the cache for the given key, the application skips the database entirely and gets its results straight from the cache. This is blazing fast compared to a full round-trip to the database.
Caching is a key strategy for fast UX and healthy, optimized infrastructure. You can cache just about anything in theory, but common cached data includes:
Expensive database queries: “show the current cart for user X” or “featured products” - queries that are reused frequently or generally have the same result for lots of users
Computed results: aggregate metrics or analytics data only need to be recalculated when the underlying data changes
Static assets: images, fonts, and CSS files that are generally unchanging and used frequently in your application.
So, let’s set up a cache and see the performance benefits in practice.
Setting up a simple Redis cache in Python
When it comes to caching, nothing’s quite as popular as Redis - a free, source-available tool used by millions of developers. My favorite definition is from Simon Willison's workshop: Redis is "a little server of awesome". It's an in-memory key-value store that is often used as a database, cache, and message broker. Due to its speed and efficiency, it is suitable for a variety of real-time applications.
For this post though, we’ll keep it focused on using Redis to speed up your database calls with caching.
The emphasis on performance means that even on a typical laptop you can process hundreds of thousands of operations in a second, all with sub-millisecond latency. With its in-memory storage, key-value data structure, persistence, and atomicity, caching frequently accessed data is easy and will reduce latency and decrease load on primary SQL and NoSQL databases.
Even better, you don't need to set up a database in Redis to set up caching. Let's walk through an example of how we can set up Redis as a caching layer for a PostgreSQL database using Python:
Spin up Redis so we can use it as a caching layer by importing Redis and calling
redis.Redis()Attempt to get the data from the cache by calling
cache.get()and loading the json if data is returned.Fall back to querying the database if the data is absent, and adding it to the cache.
import redis cache = redis.Redis(host='localhost', port=6379, db=0) def get_data_with_cache(key): # check the cache for data first cached_data = cache.get(key) if cached_data: return json.loads(cached_data) # return cached result data = get_expensive_data_from_db() # query the DB however you need # store the result in Redis with a Time-to-Live (TTL) of 1 hour (3600s) cache.setex(key, 3600, json.dumps(data)) return data
When cache.get(key) returns None, it means the requested data isn’t in the cache (aka a “cache miss”). The app then queries the database (get_expensive_data_from_db()), retrieves the fresh result, stores the result in the cache with cache.setex(...) and returns it to the user.
What’s great about this example is we’re only using Redis as the caching layer - we can use whatever database we want and still get massive load reductions on our backend and substantial performance improvements for our user interactions.
Now that we know how to get started with setting up a caching layer, let’s track down some common performance issues we could fix with caching.
How to spot cache-worthy operations with Sentry
Some database operations are extremely costly, frequently pinged, or generally slow. These are often the best candidates for a cache - so let’s see how you can use Sentry’s performance, tracing, and backend insights to quickly spot opportunities for a cache and verify the improvements!
1: High-duration transactions
Slow operations can be tough to spot manually because you have to recreate sessions on your local browser and trace the interaction. But there is often middleware that isn’t traced by your local browser, which can completely abstract away cache hits/misses.
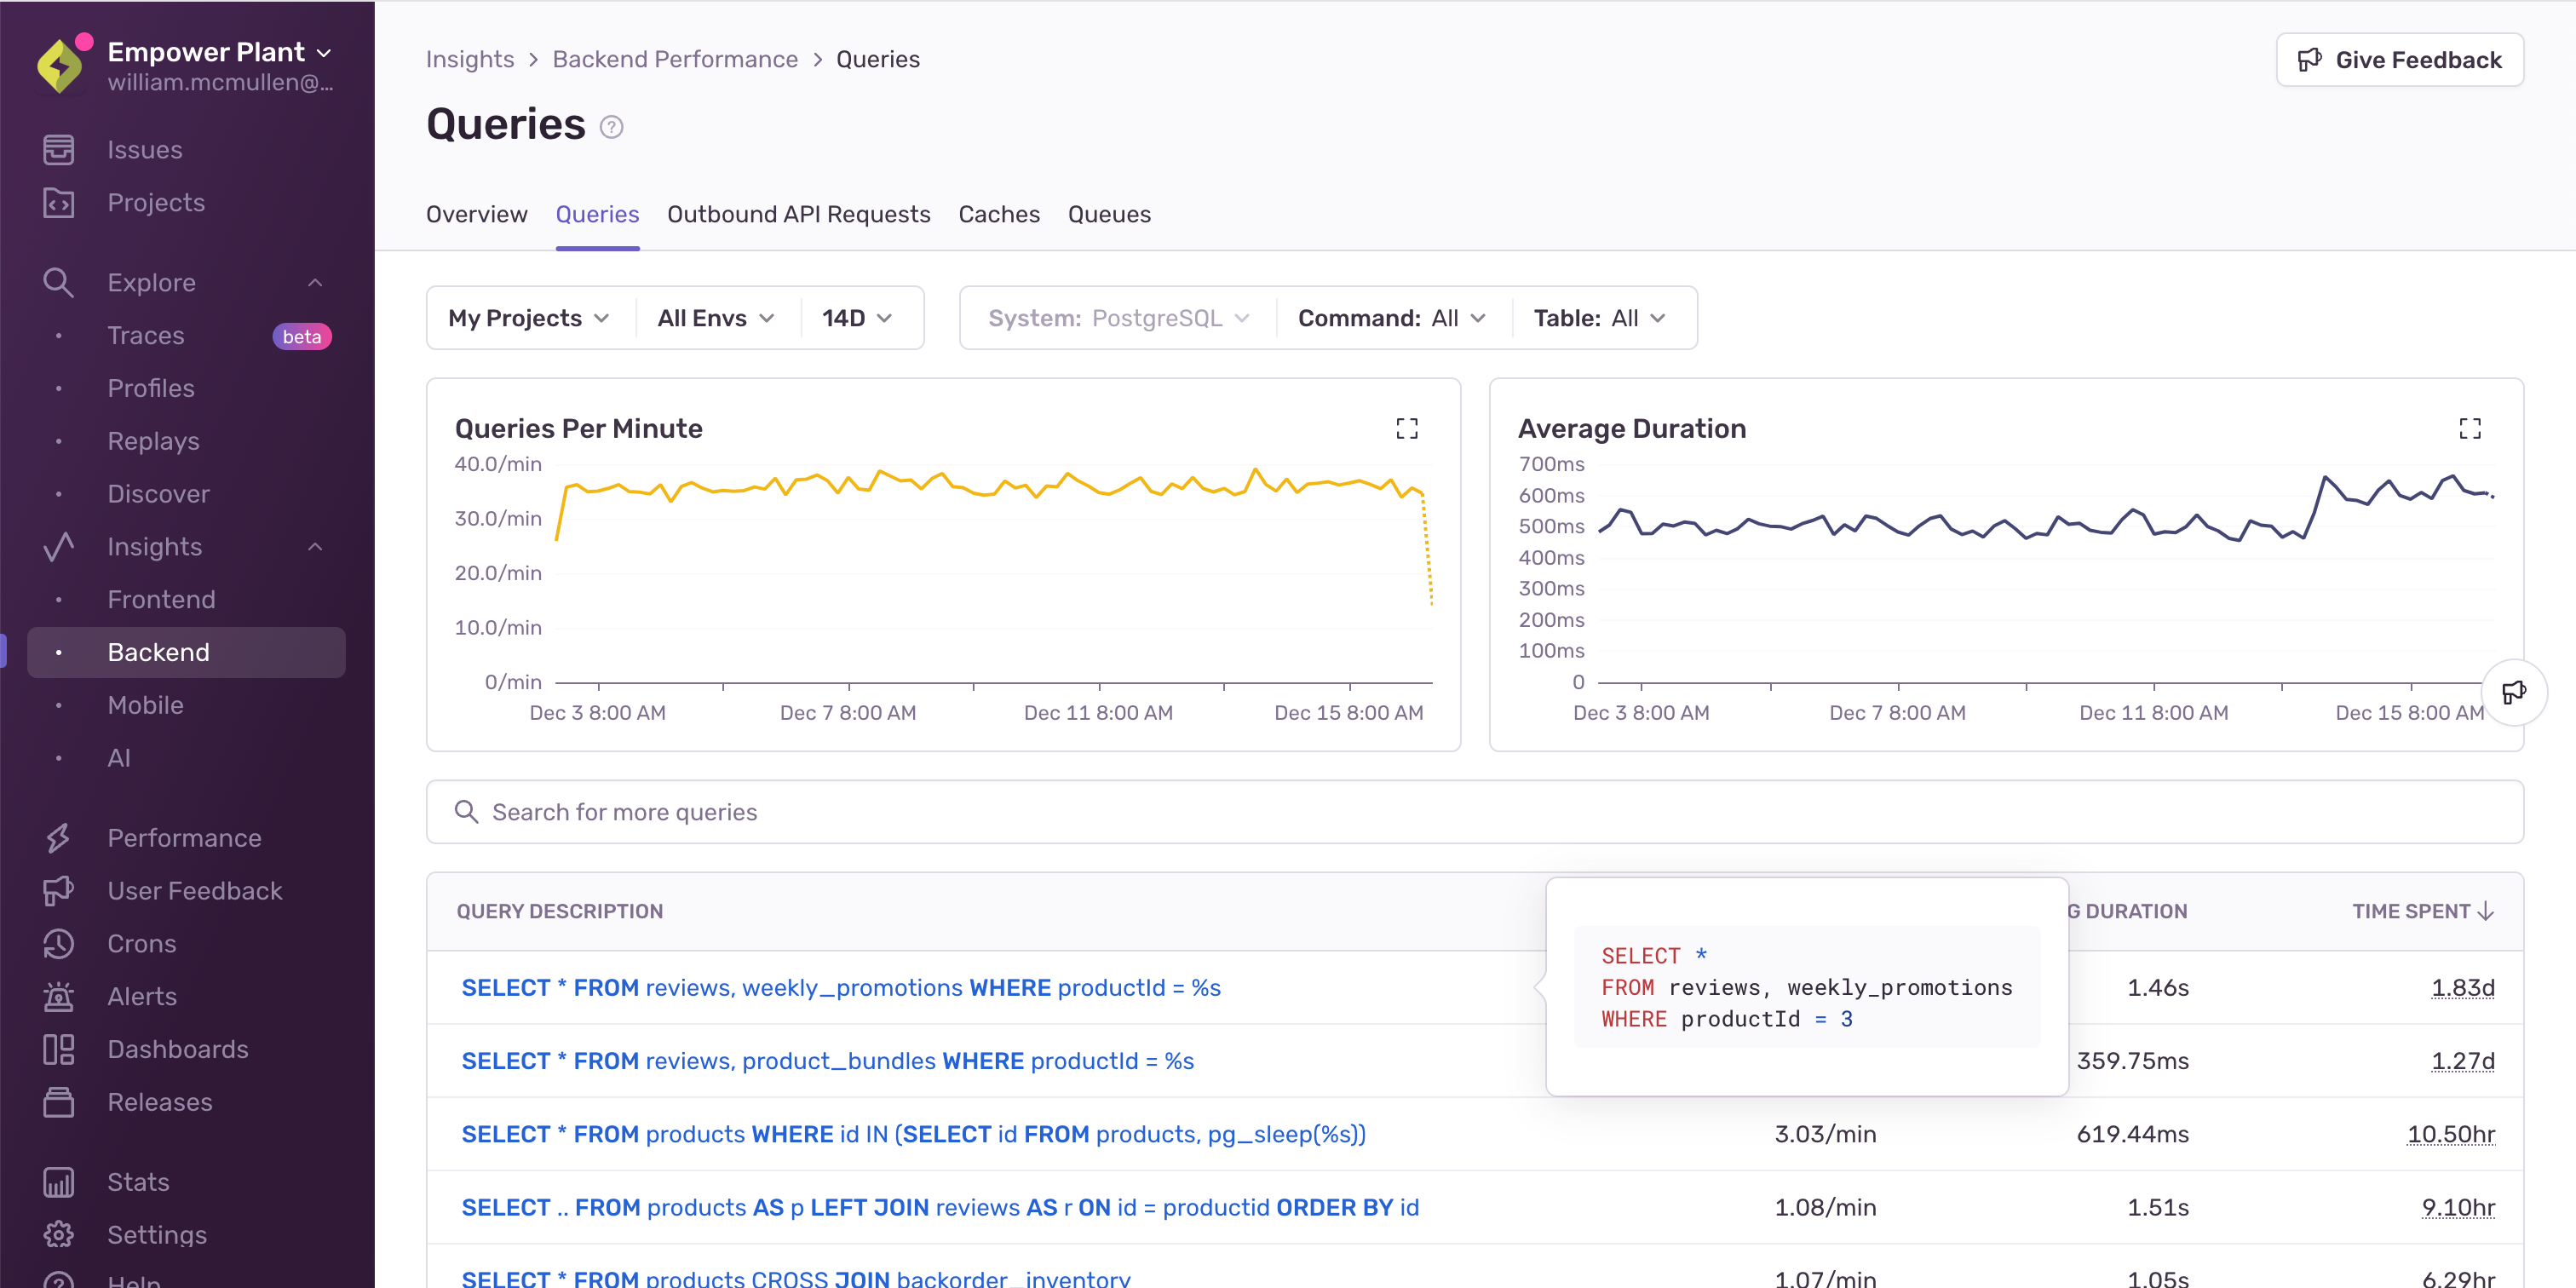
This means slow operations are primed for caching, and if you configure performance monitoring with Sentry, you can immediately spot your slowest queries across your entire stack.
Sentry’s Backend Insights shows you the slowest queries anywhere you have tracing enabled. This can help you quickly spot where you want to prioritize caching resources. Once you’ve set up a cache, you should immediately start to see major performance improvements.
Note: We also strongly recommend making sure your slowest queries are indexed so that any fallback queries are still as fast as possible.
2: Repeated spans
None of us should be constantly running MONITOR on our SQL databases (or similar on NoSQL / Redis etc.) and taking massive performance hits in production. But without that, there’s basically no way to see what queries are being run the most frequently with the same key. With Sentry’s distributed tracing and Backend Insights, however, these opportunities are extremely easy to spot:
In this distributed trace, we see the same query with different productIds, being called four times in succession, adding 1.3s of latency. This is a perfect opportunity for a cache: if you see the same span being triggered on many different transactions or user sessions, adding a cache can be a super easy way to immediately improve performance for all of those transactions. When you add caching, just be careful with your Time to Live (TTL) duration. You don’t want your Redis instance getting too bloated and slowing down transactions because of cache lookups.
3: Slow external API calls
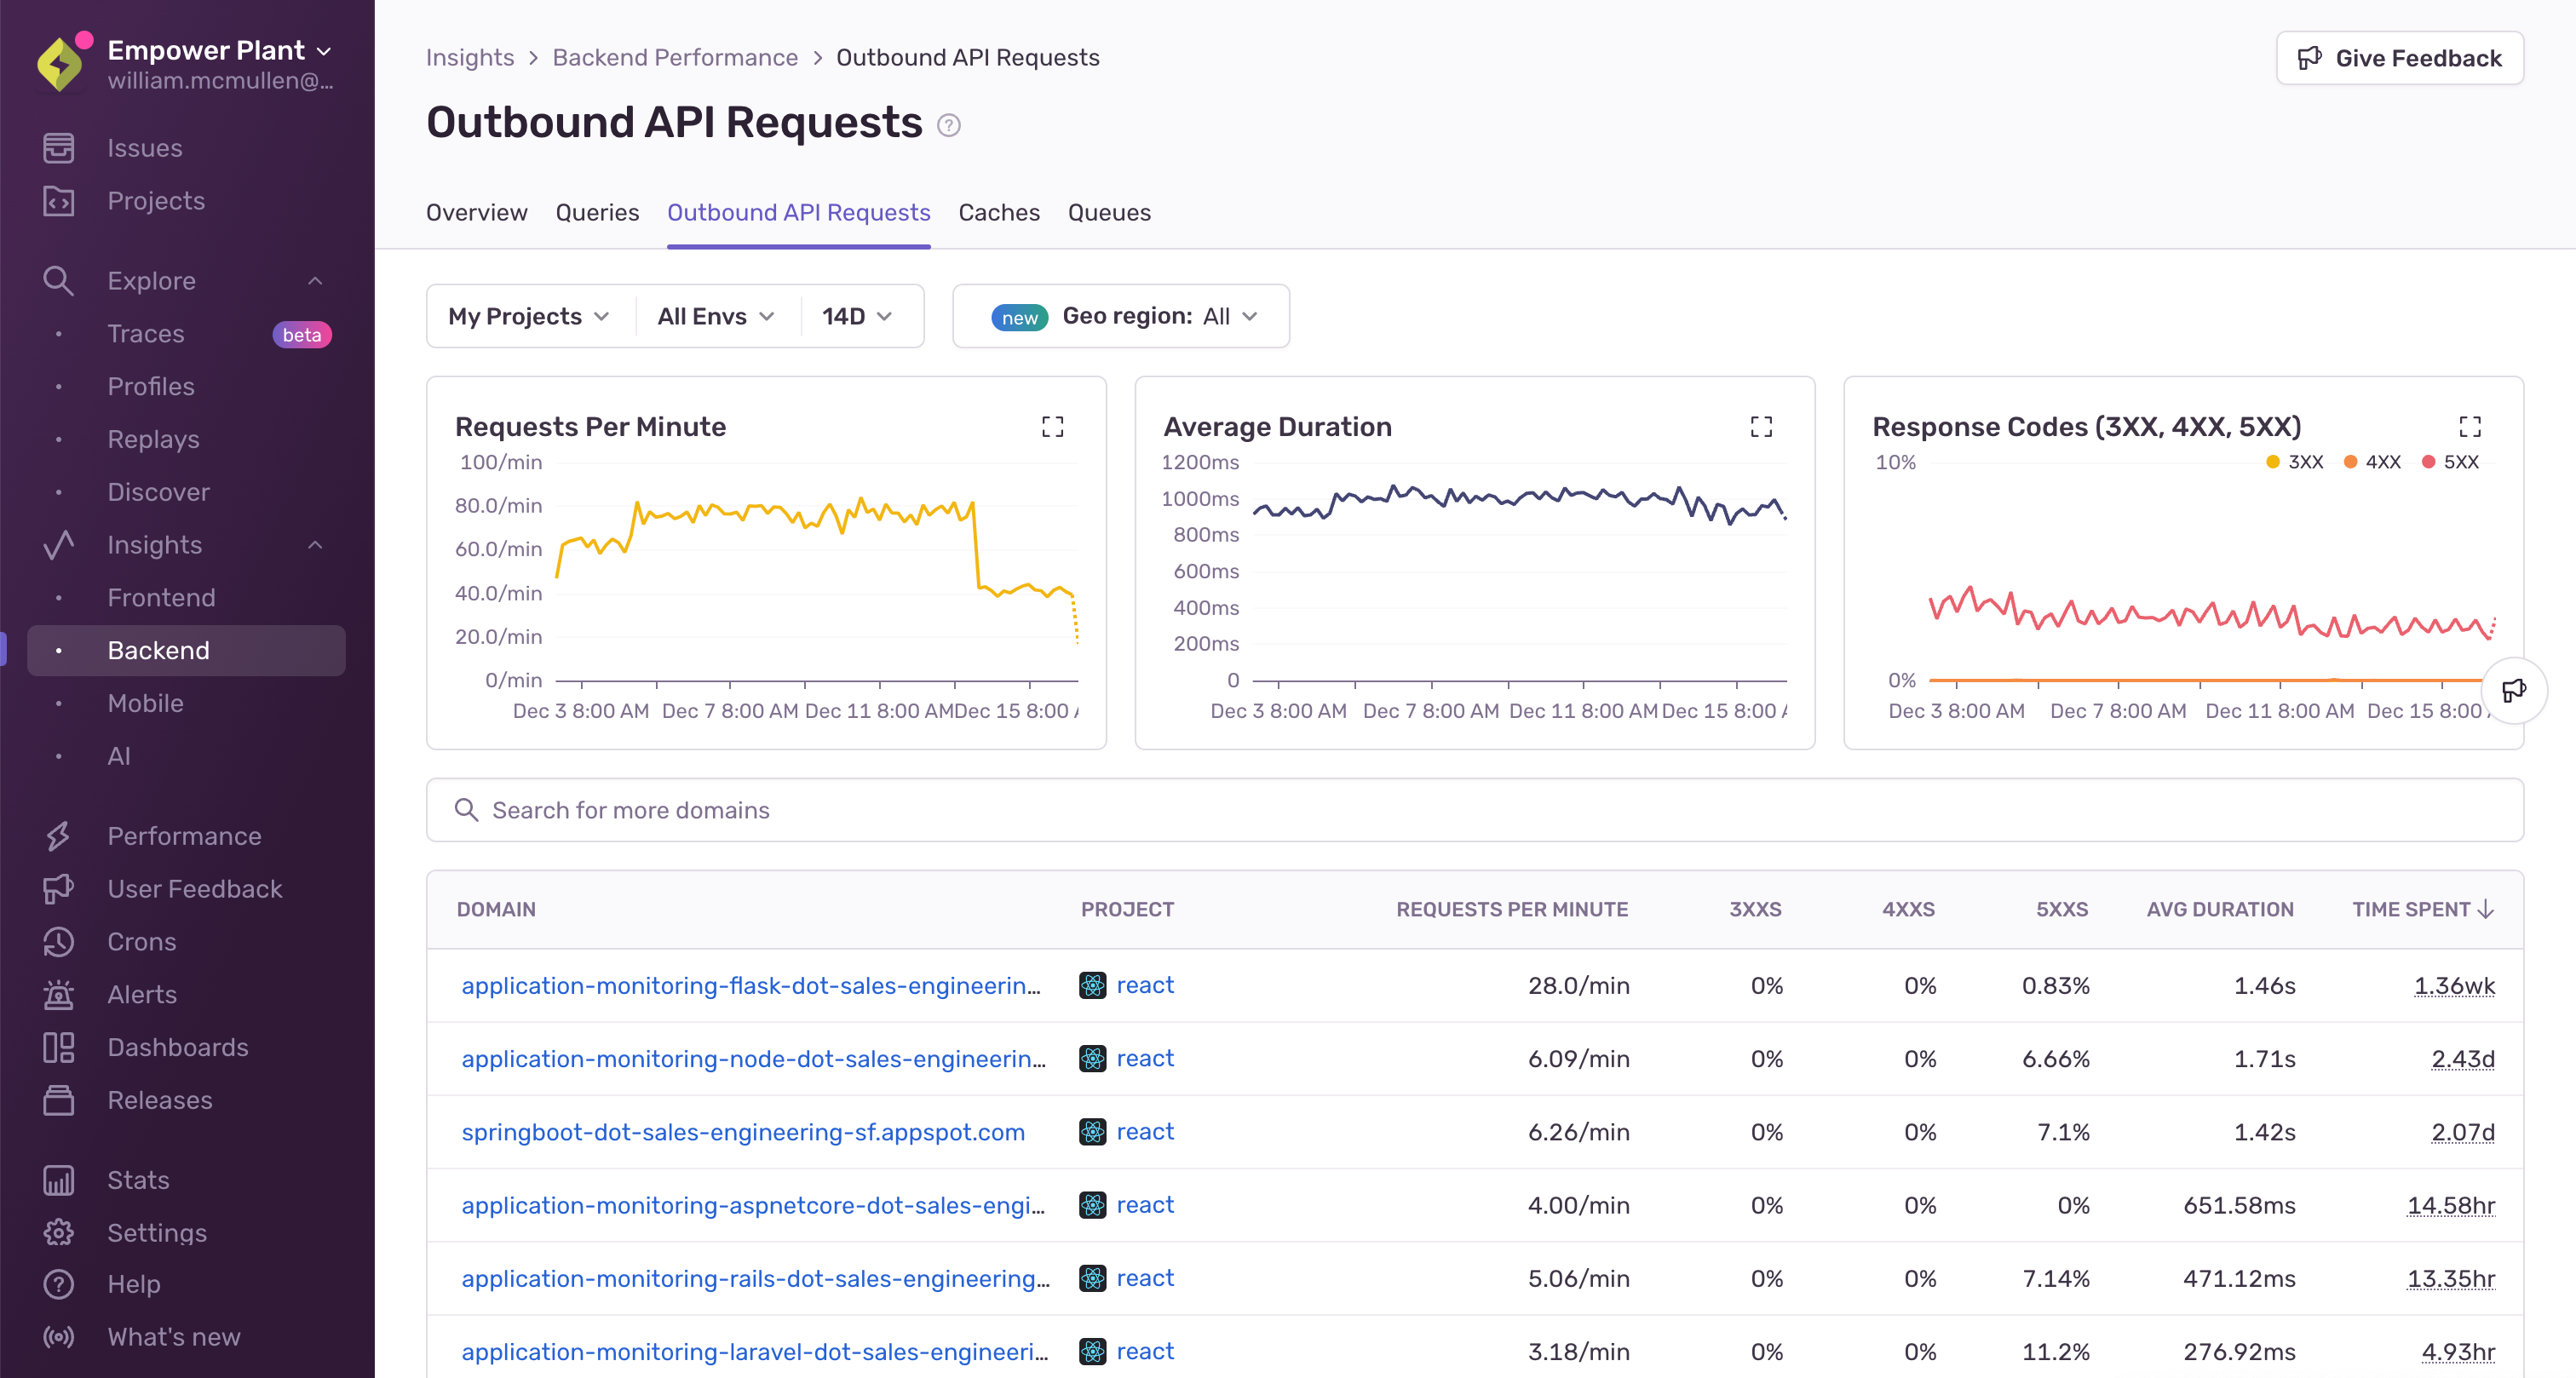
Like the above examples, debugging locally is possible, but incomplete. Many conditions can affect API call performance, for example API response often differs largely across the globe and depending on the time of day. Sentry gives insights when you’re still developing and testing locally, but the most impactful insights come from monitoring your application in production. And leveraging aggregate data across all of your real users makes it extremely easy to identify the outliers across transactions and identify the most commonly queried ones that could benefit from a cache:
Once you’ve identified your most costly API calls in terms of total user duration, you can start experimenting with adding a caching layer via Redis or similar to fetch the keyed data instead of always round-tripping to the endpoint. This can also have positive impacts on things like rate limiting and 3rd party expenses.
Find and fix caching issues faster with Sentry
Every millisecond saved by caching counts, both in user experience and infrastructure. Sentry makes it easy to find cache-worthy database and API operations anywhere in your stack, and monitor them to make sure they’re working as you expect.
Optimize smarter, debug faster, and keep users (and your infrastructure bill) happy. Ready to level up your performance monitoring? Give Sentry for Performance a shot today with a free trial. Questions or thoughts? Join our Discord here.


