On March 12, 2024, Google made Interaction to Next Paint (INP) a Core Web Vital, replacing First Input Delay (FID). INP changes how sites are assessed for responsiveness, and that still affects how your pages perform in search and for real users.
TL;DR: Optimize for INP. It measures responsiveness across the whole visit, not just the first tap.
Why the change?
The FID Core Web Vital was designed to measure how quickly a webpage responds to a user’s first action on that page. A good FID score is achieved at 100ms or less.
However, “Chrome usage data shows that 90% of a user’s time on a page is spent after it loads,” so FID doesn’t capture the full user experience. As a result, INP has been designed to measure a page’s overall perceived responsiveness by observing clicks, taps and key presses across the entire user journey on the page — rather than just the first interaction.
The final INP value is calculated as the longest time observed between the user performing an action and receiving visual feedback. Examples of user interactions include clicking a button to add a product to a cart, clicking an expandable accordion or tapping a collapsed navigation menu, and typing into an input field. INP focuses on the time it takes for visual feedback to be presented after a particular action is performed (i.e. the next paint — where painting is the process in which browsers add pixels to the screen), and it excludes eventual effects of an interaction (such as network requests or UI updates).
Investigating INP in dev tools
Let’s look at how to investigate actions and events that contribute to the INP metric using Chromium-based browsers such as Chrome, Brave, Edge, and Arc.
Choose a web page that accepts one of the following user interactions that INP measures (scrolling and moving the pointer, for example, is not measured):
Clicking with a mouse
Tapping on a device with a touchscreen
Pressing a key on either a physical or onscreen keyboard
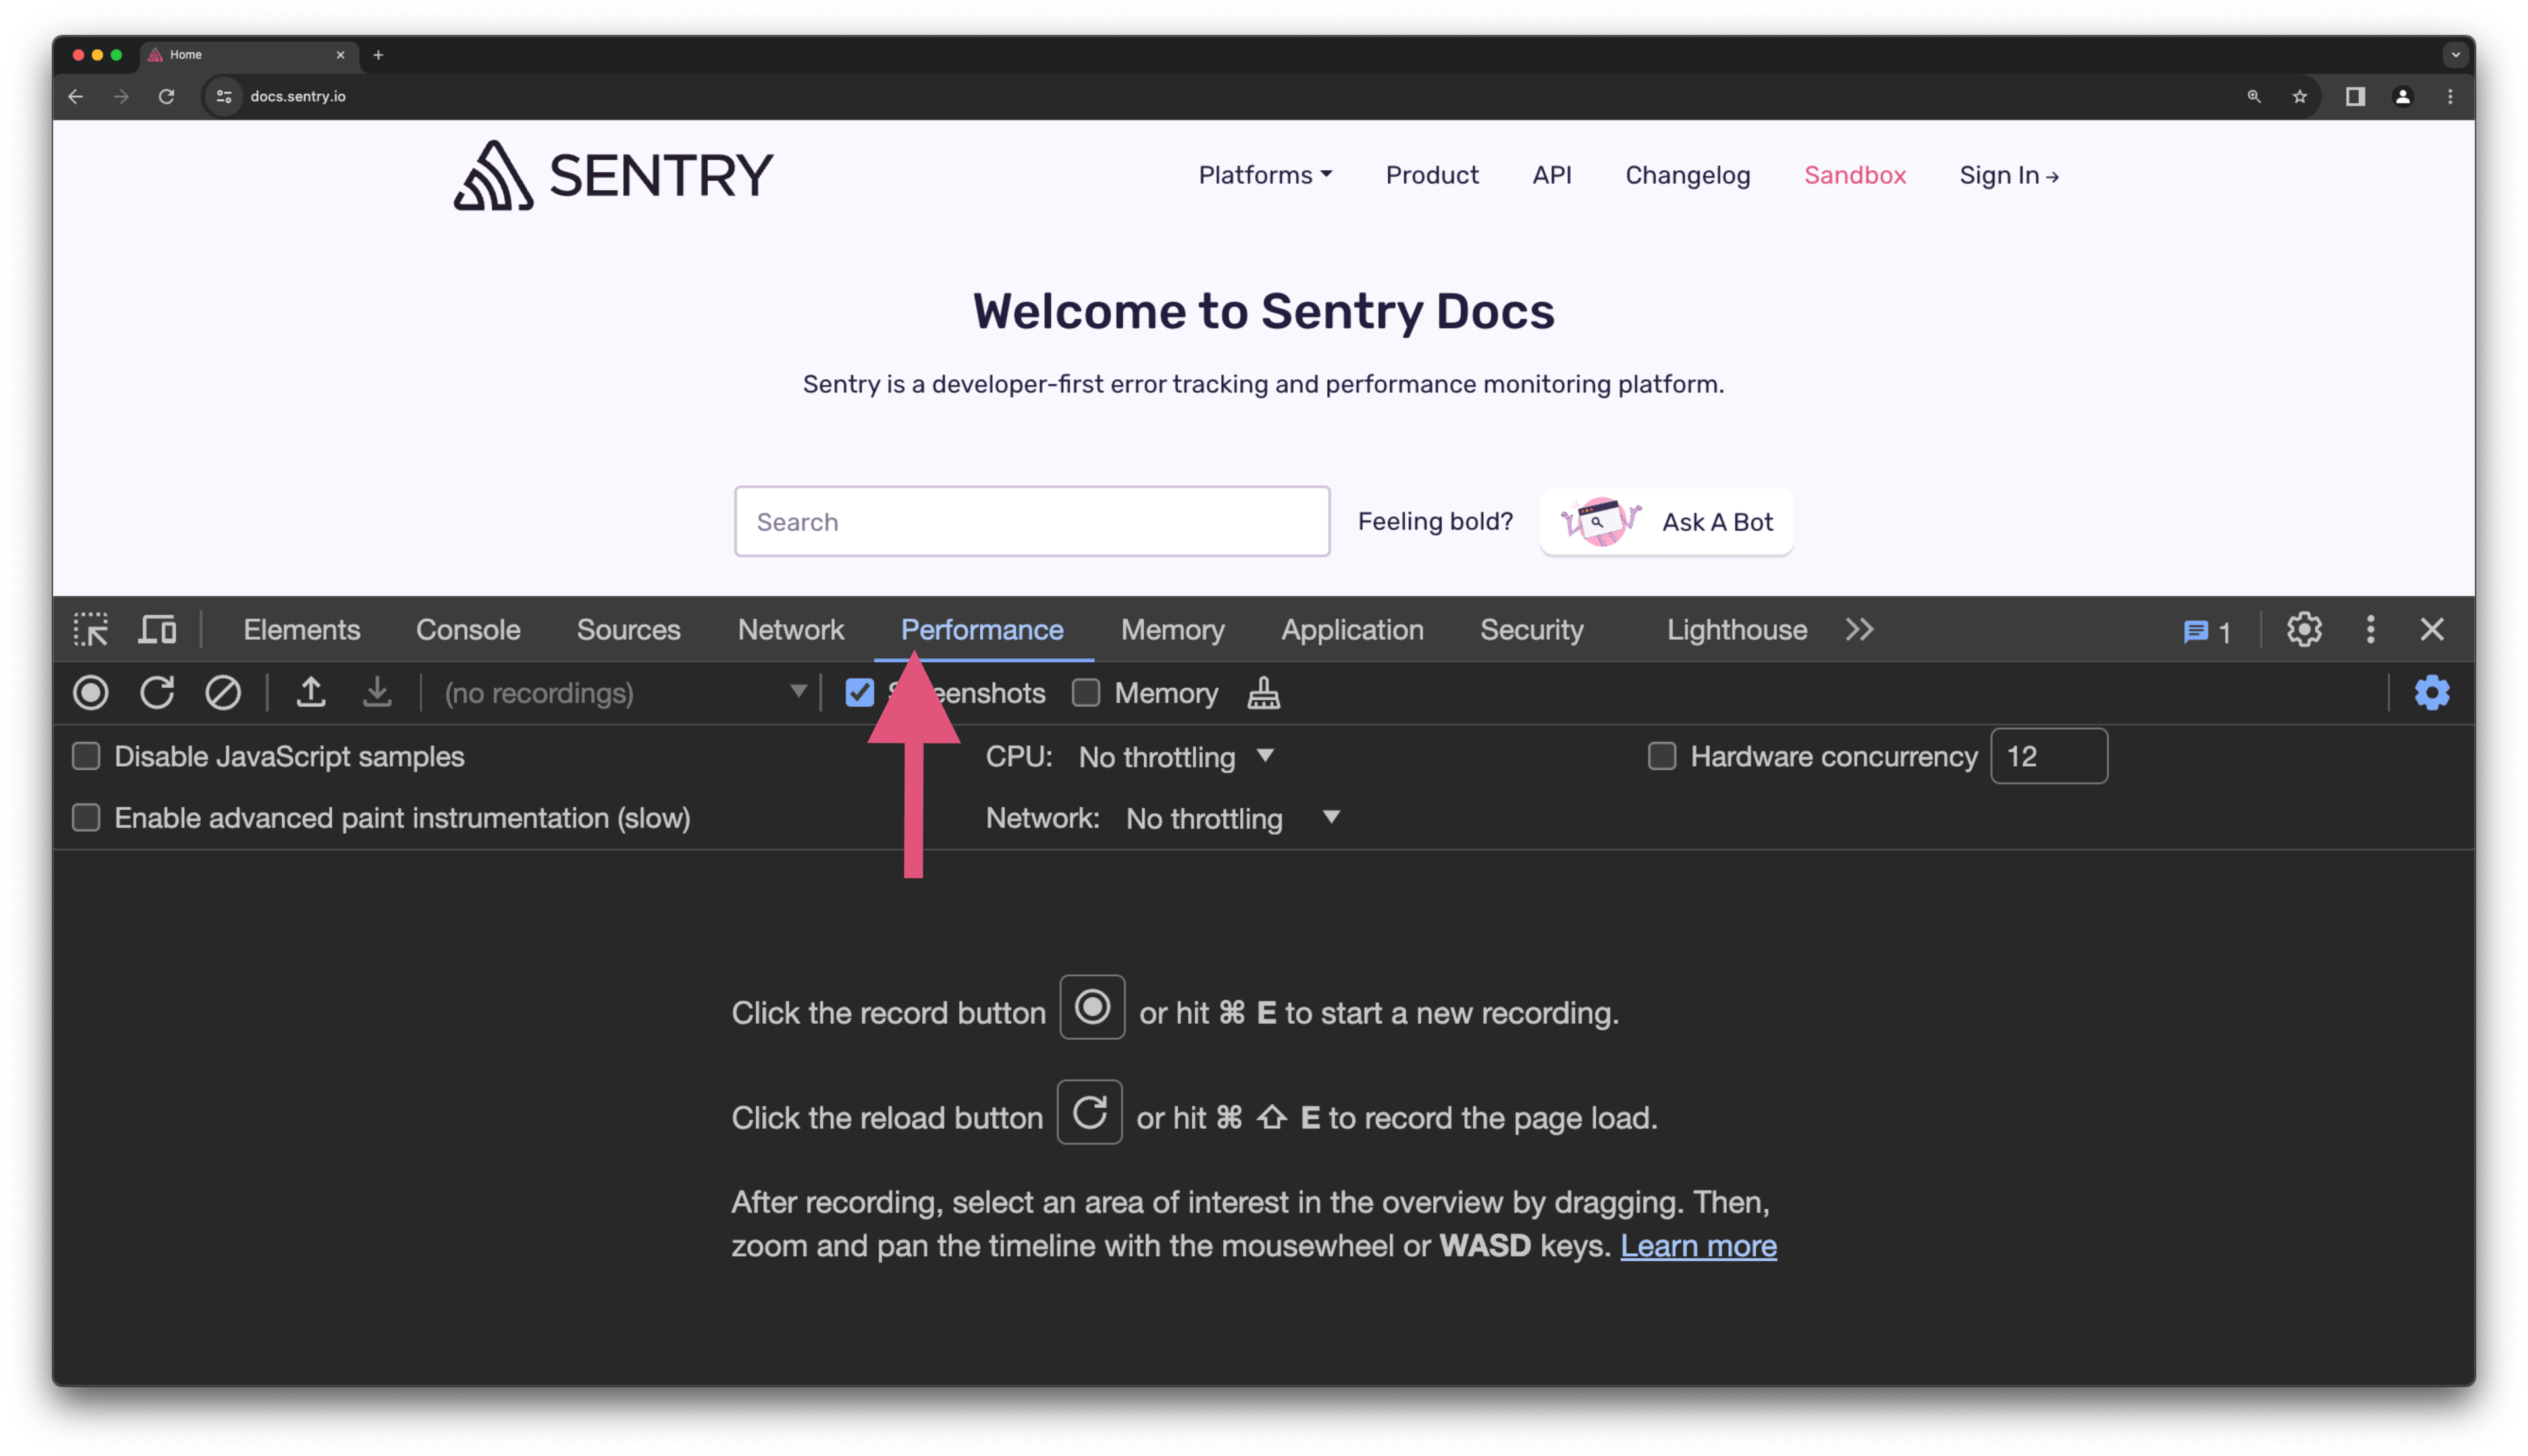

I’ve chosen to investigate what happens when I search for “web vitals” on the Sentry Docs home page. Open up the dev tools panel and click on the “Performance” tab.
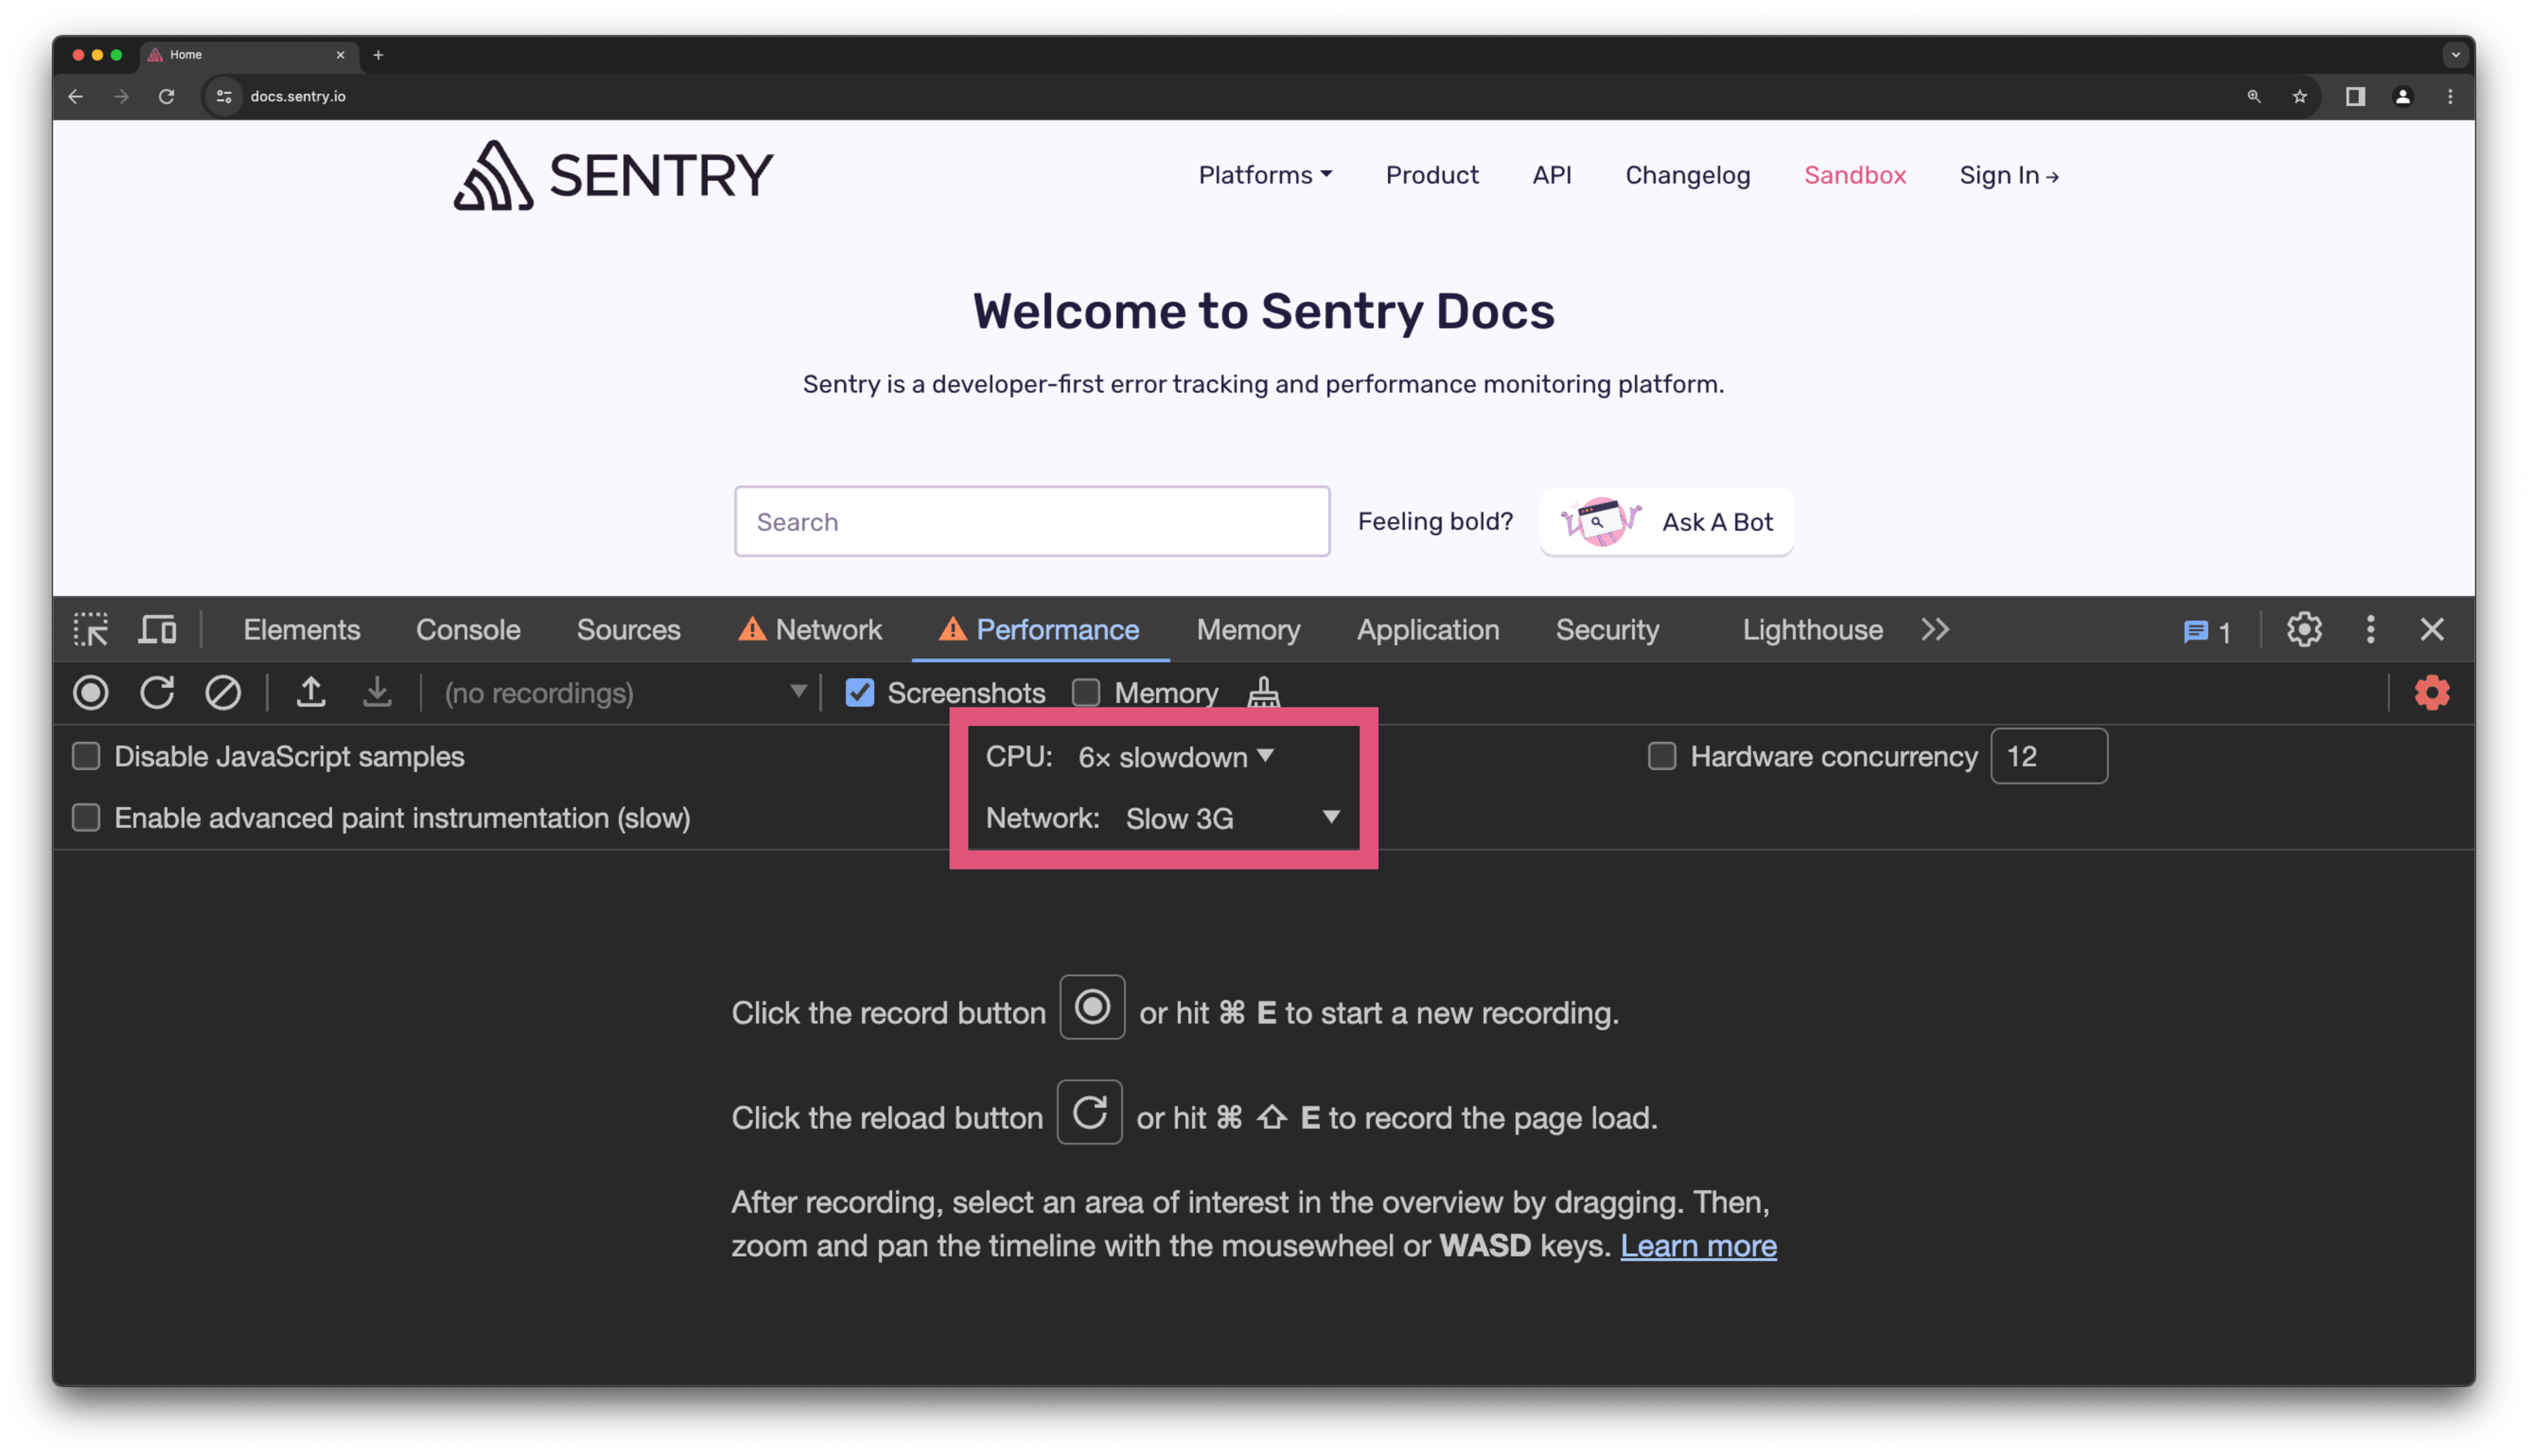
Depending on the website’s target audience, it’s often useful to throttle the CPU or network speed to analyze the user experience on older machines and/or slower internet. If you want to simulate a slower CPU or network, configure the options accordingly.
Click the record button, and perform some interactions on the page.
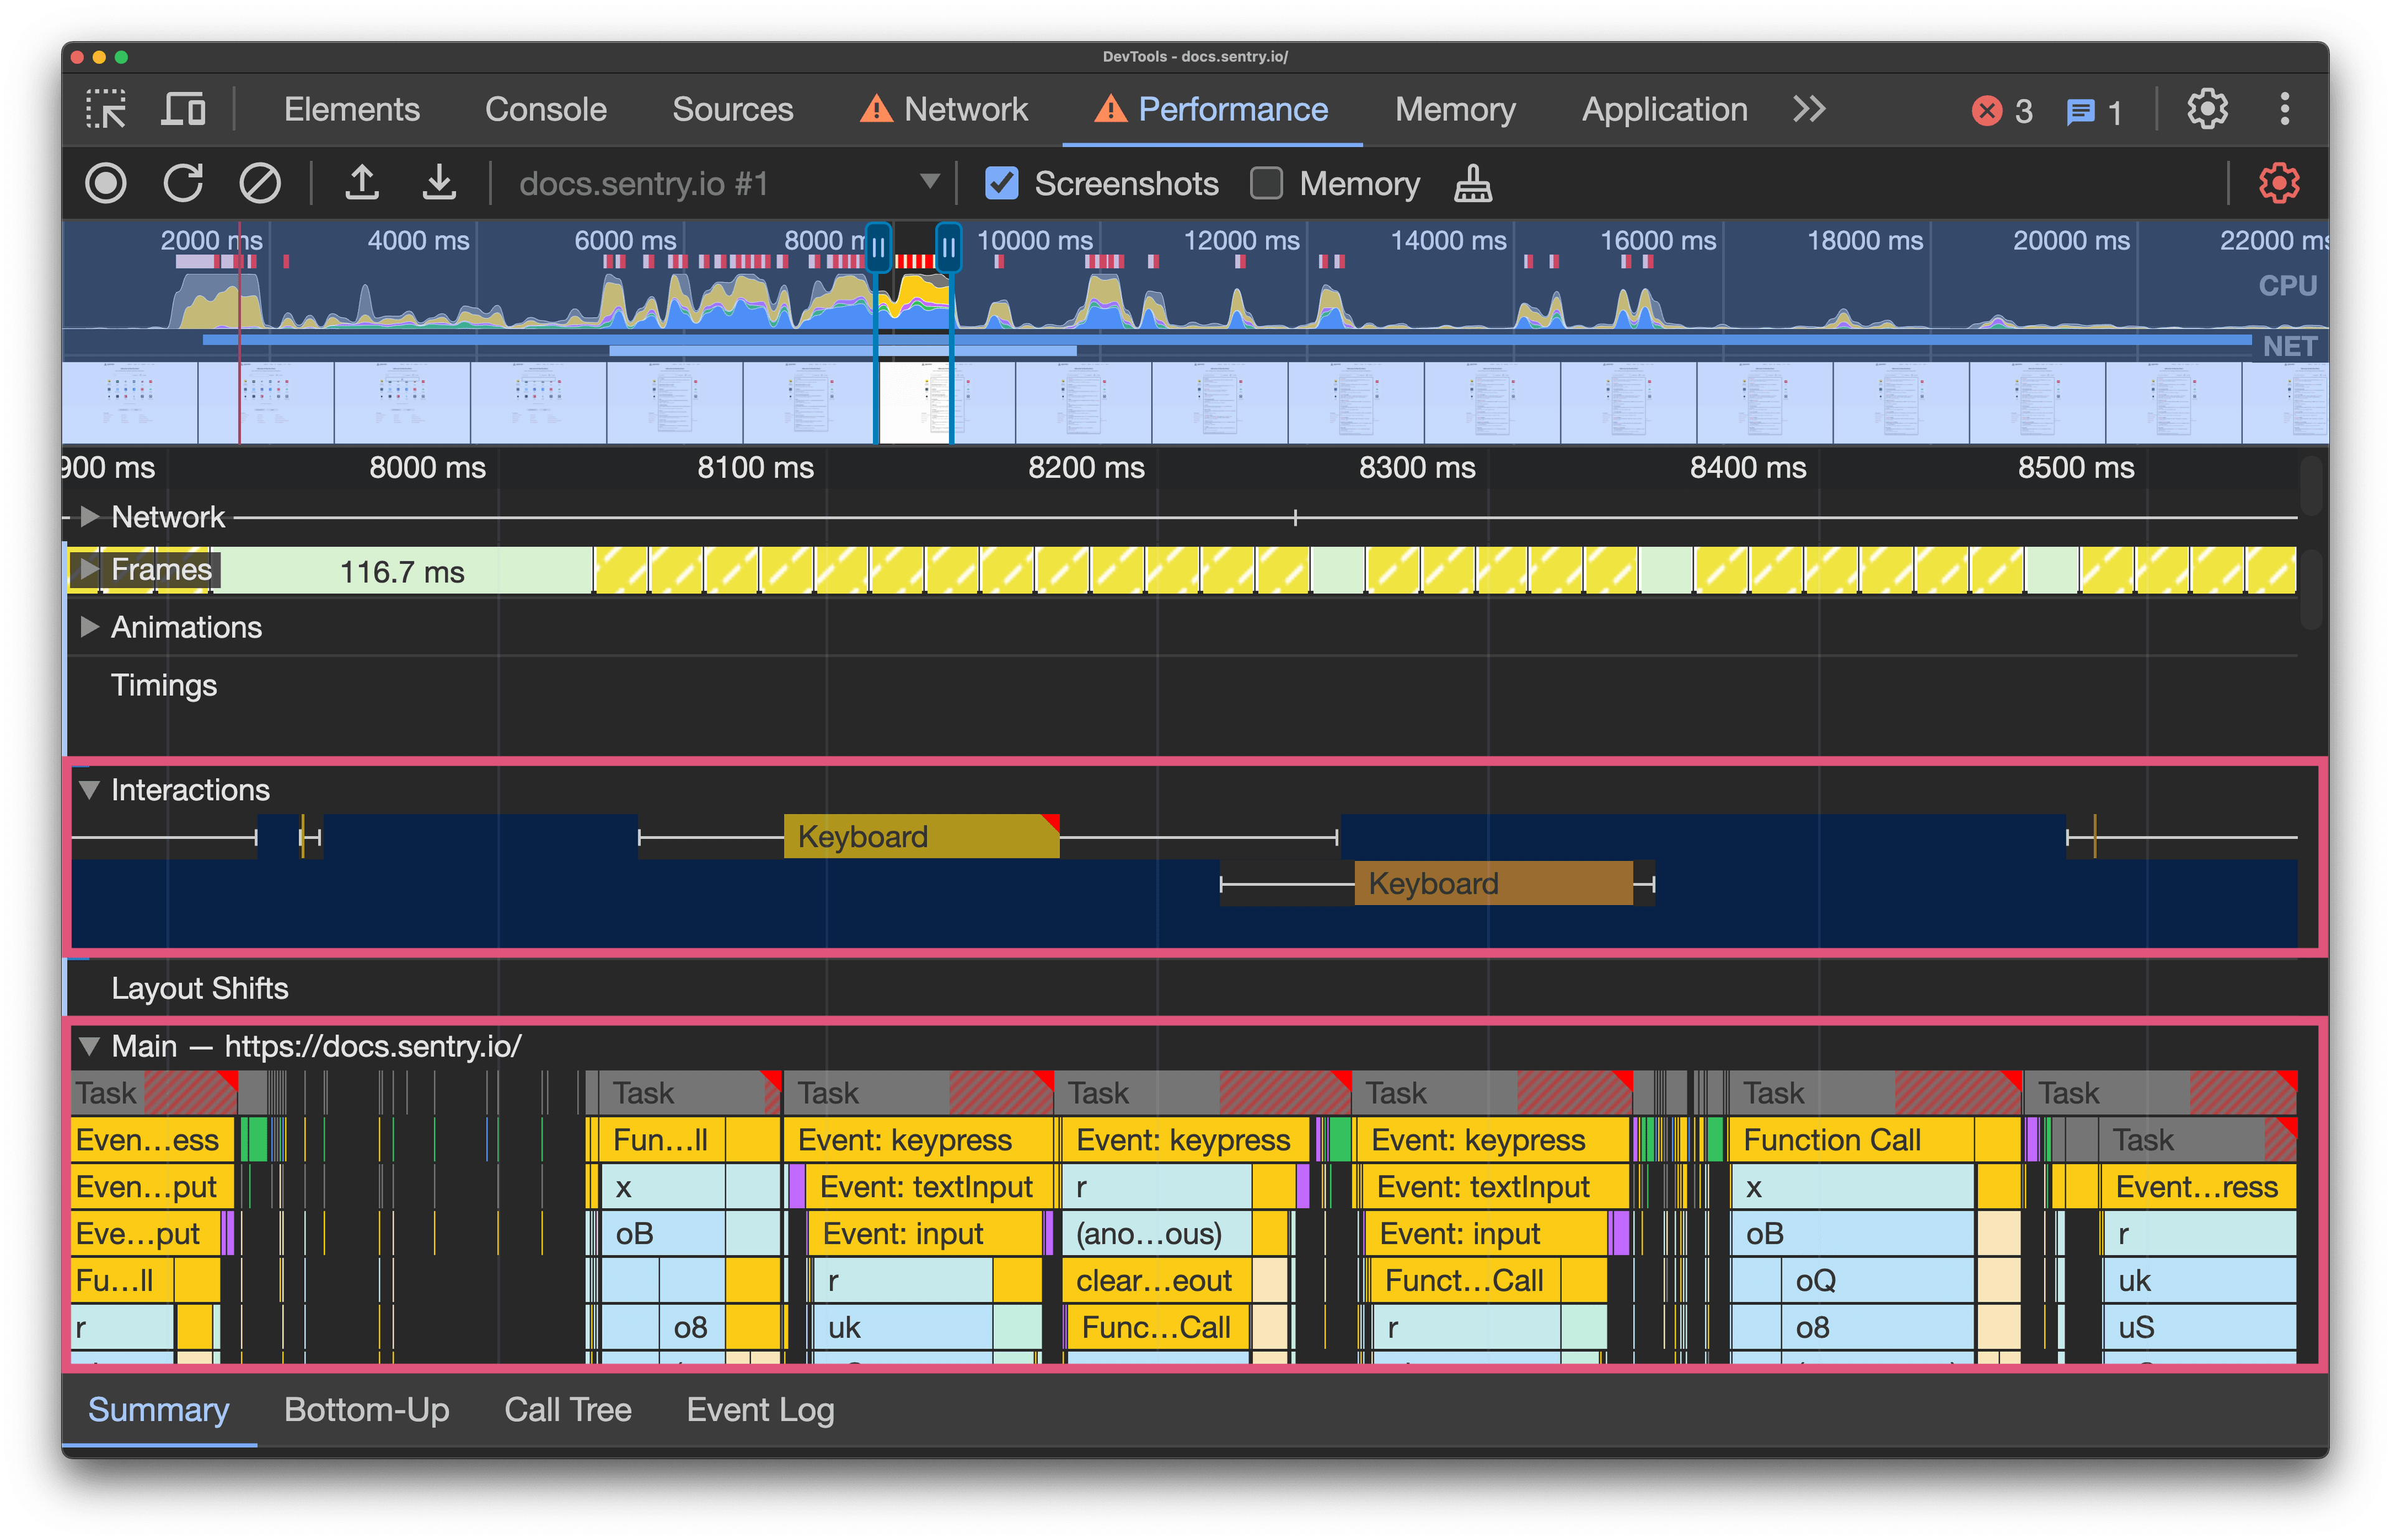
Stop recording, and wait for the profile to load. You’ll now see a LOT of data in the form of color-coded blocks with labels in named lanes. The most important lanes to zoom in on when analyzing contributing factors to INP are “Interactions” (any user interactions performed on the page) and “Main” (the browser’s main thread).
For context, the main thread is “where a browser processes user events and paints.” By default, the browser uses the main thread to run all JavaScript on a page, layout the page, recompute any changes, and allocate and free up memory (garbage collection). This means that long-running JavaScript functions can block the main thread, leading to unresponsive pages and a bad user experience. This is what Google is encouraging developers to solve by introducing the INP metric.
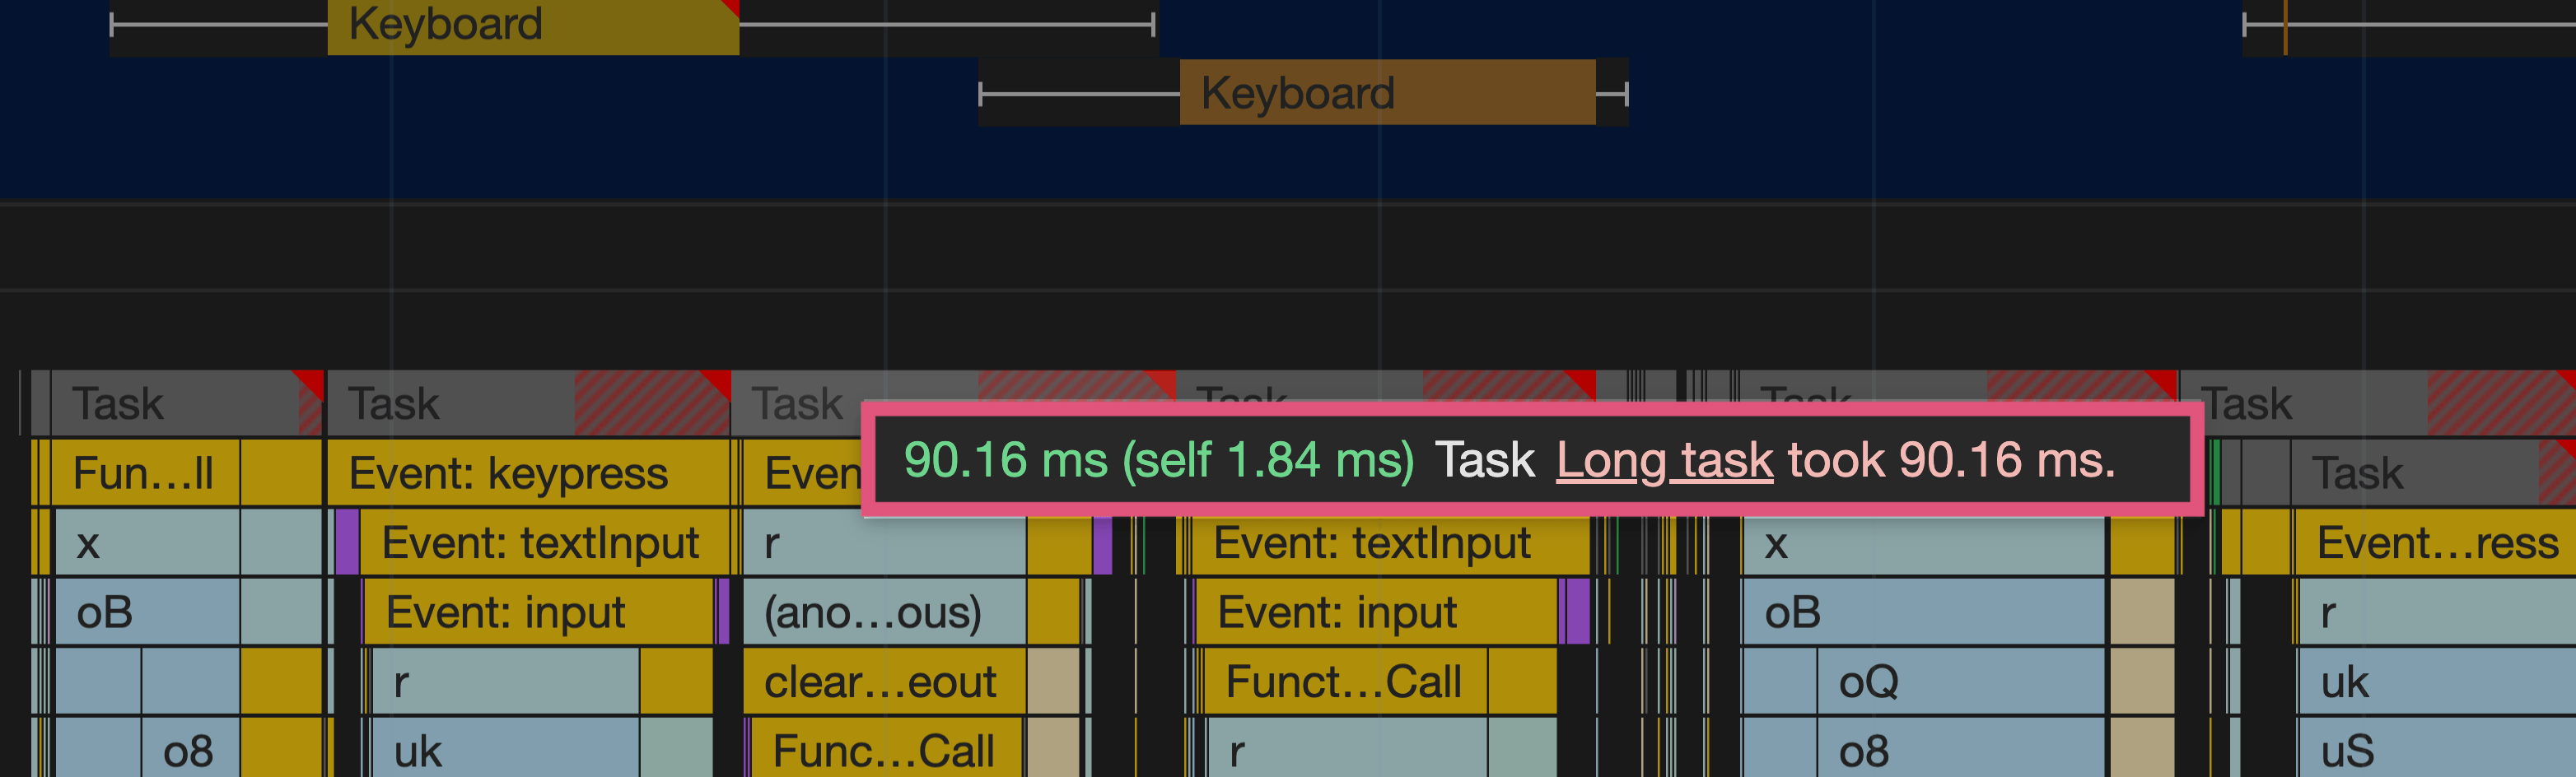
When inspecting your recorded performance profile, you may see blocks on the main thread highlighted in red; this indicates a long running task. Hovering over a task gives you the time it took to run, and under that task block, you’ll find all of the separate events and function calls that made up that task. Zoom in/out by scrolling on your mouse or trackpad, and use the scrollbars to the right of the window to scroll up and down the stack.
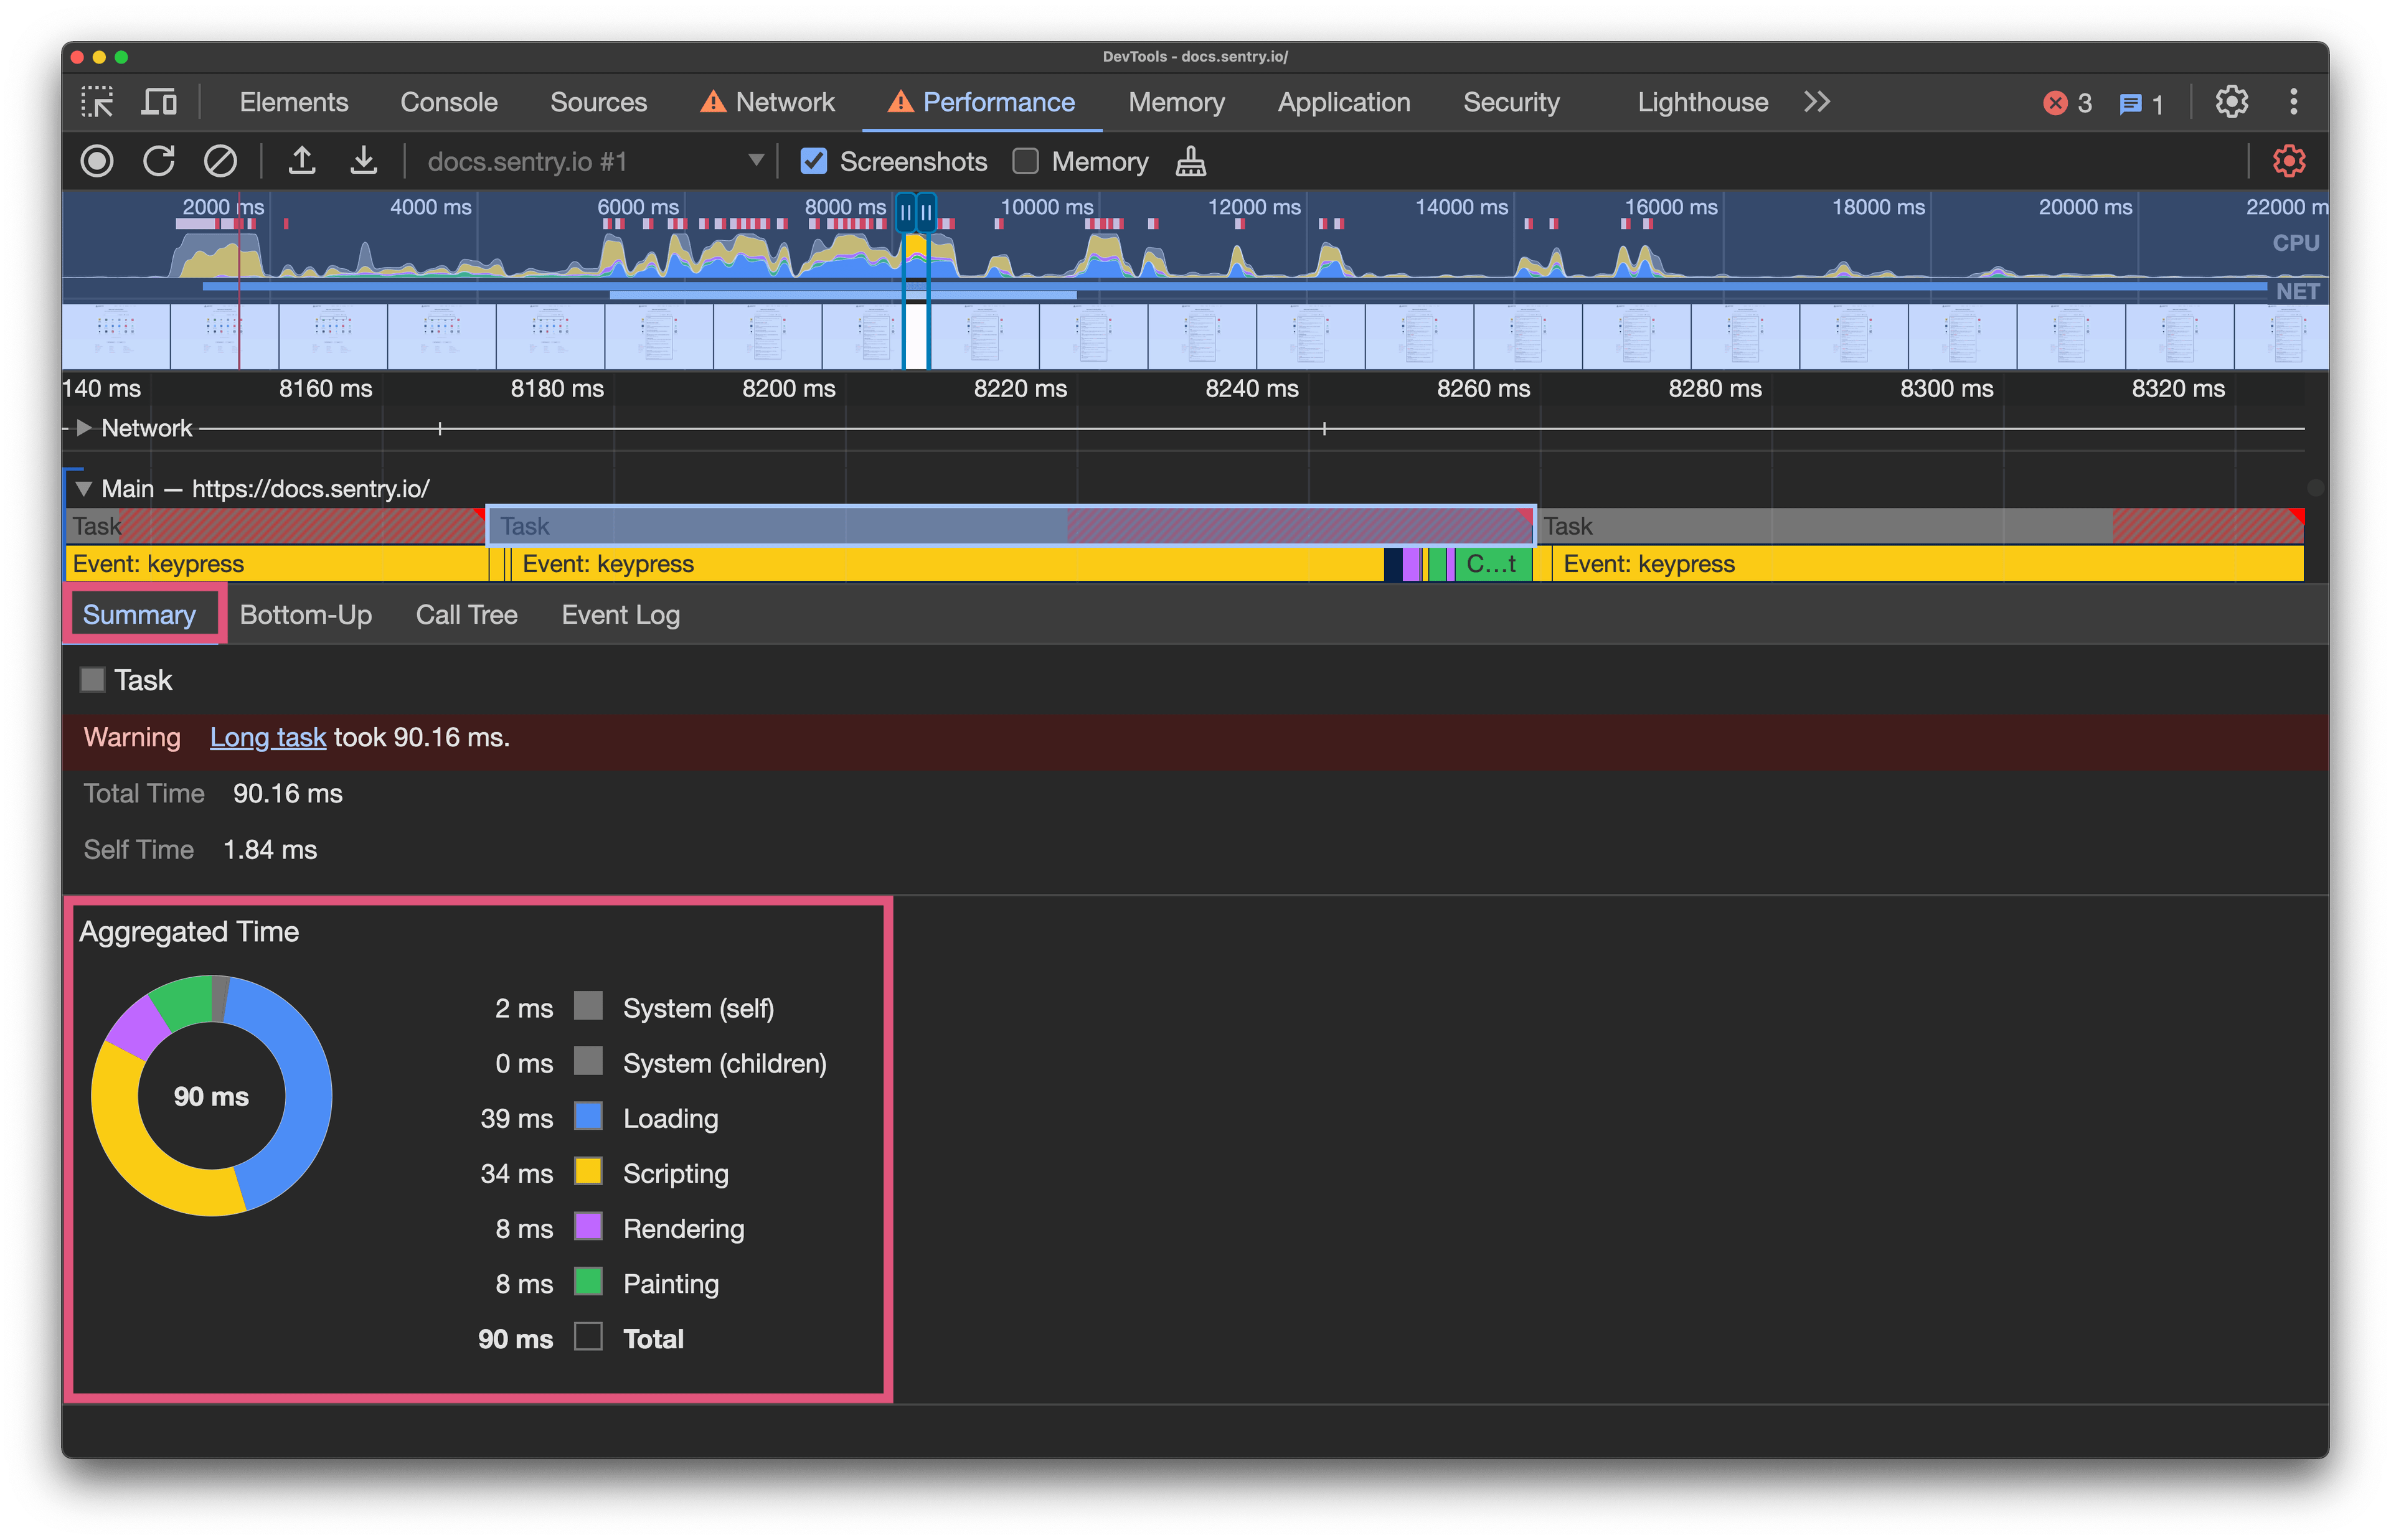
The summary tab below the lanes shows how much time in each task was allocated to different processes. This will vary between tasks, but usually you’ll observe that “Scripting” (i.e. JavaScript processes) and “Loading” takes the longest time.
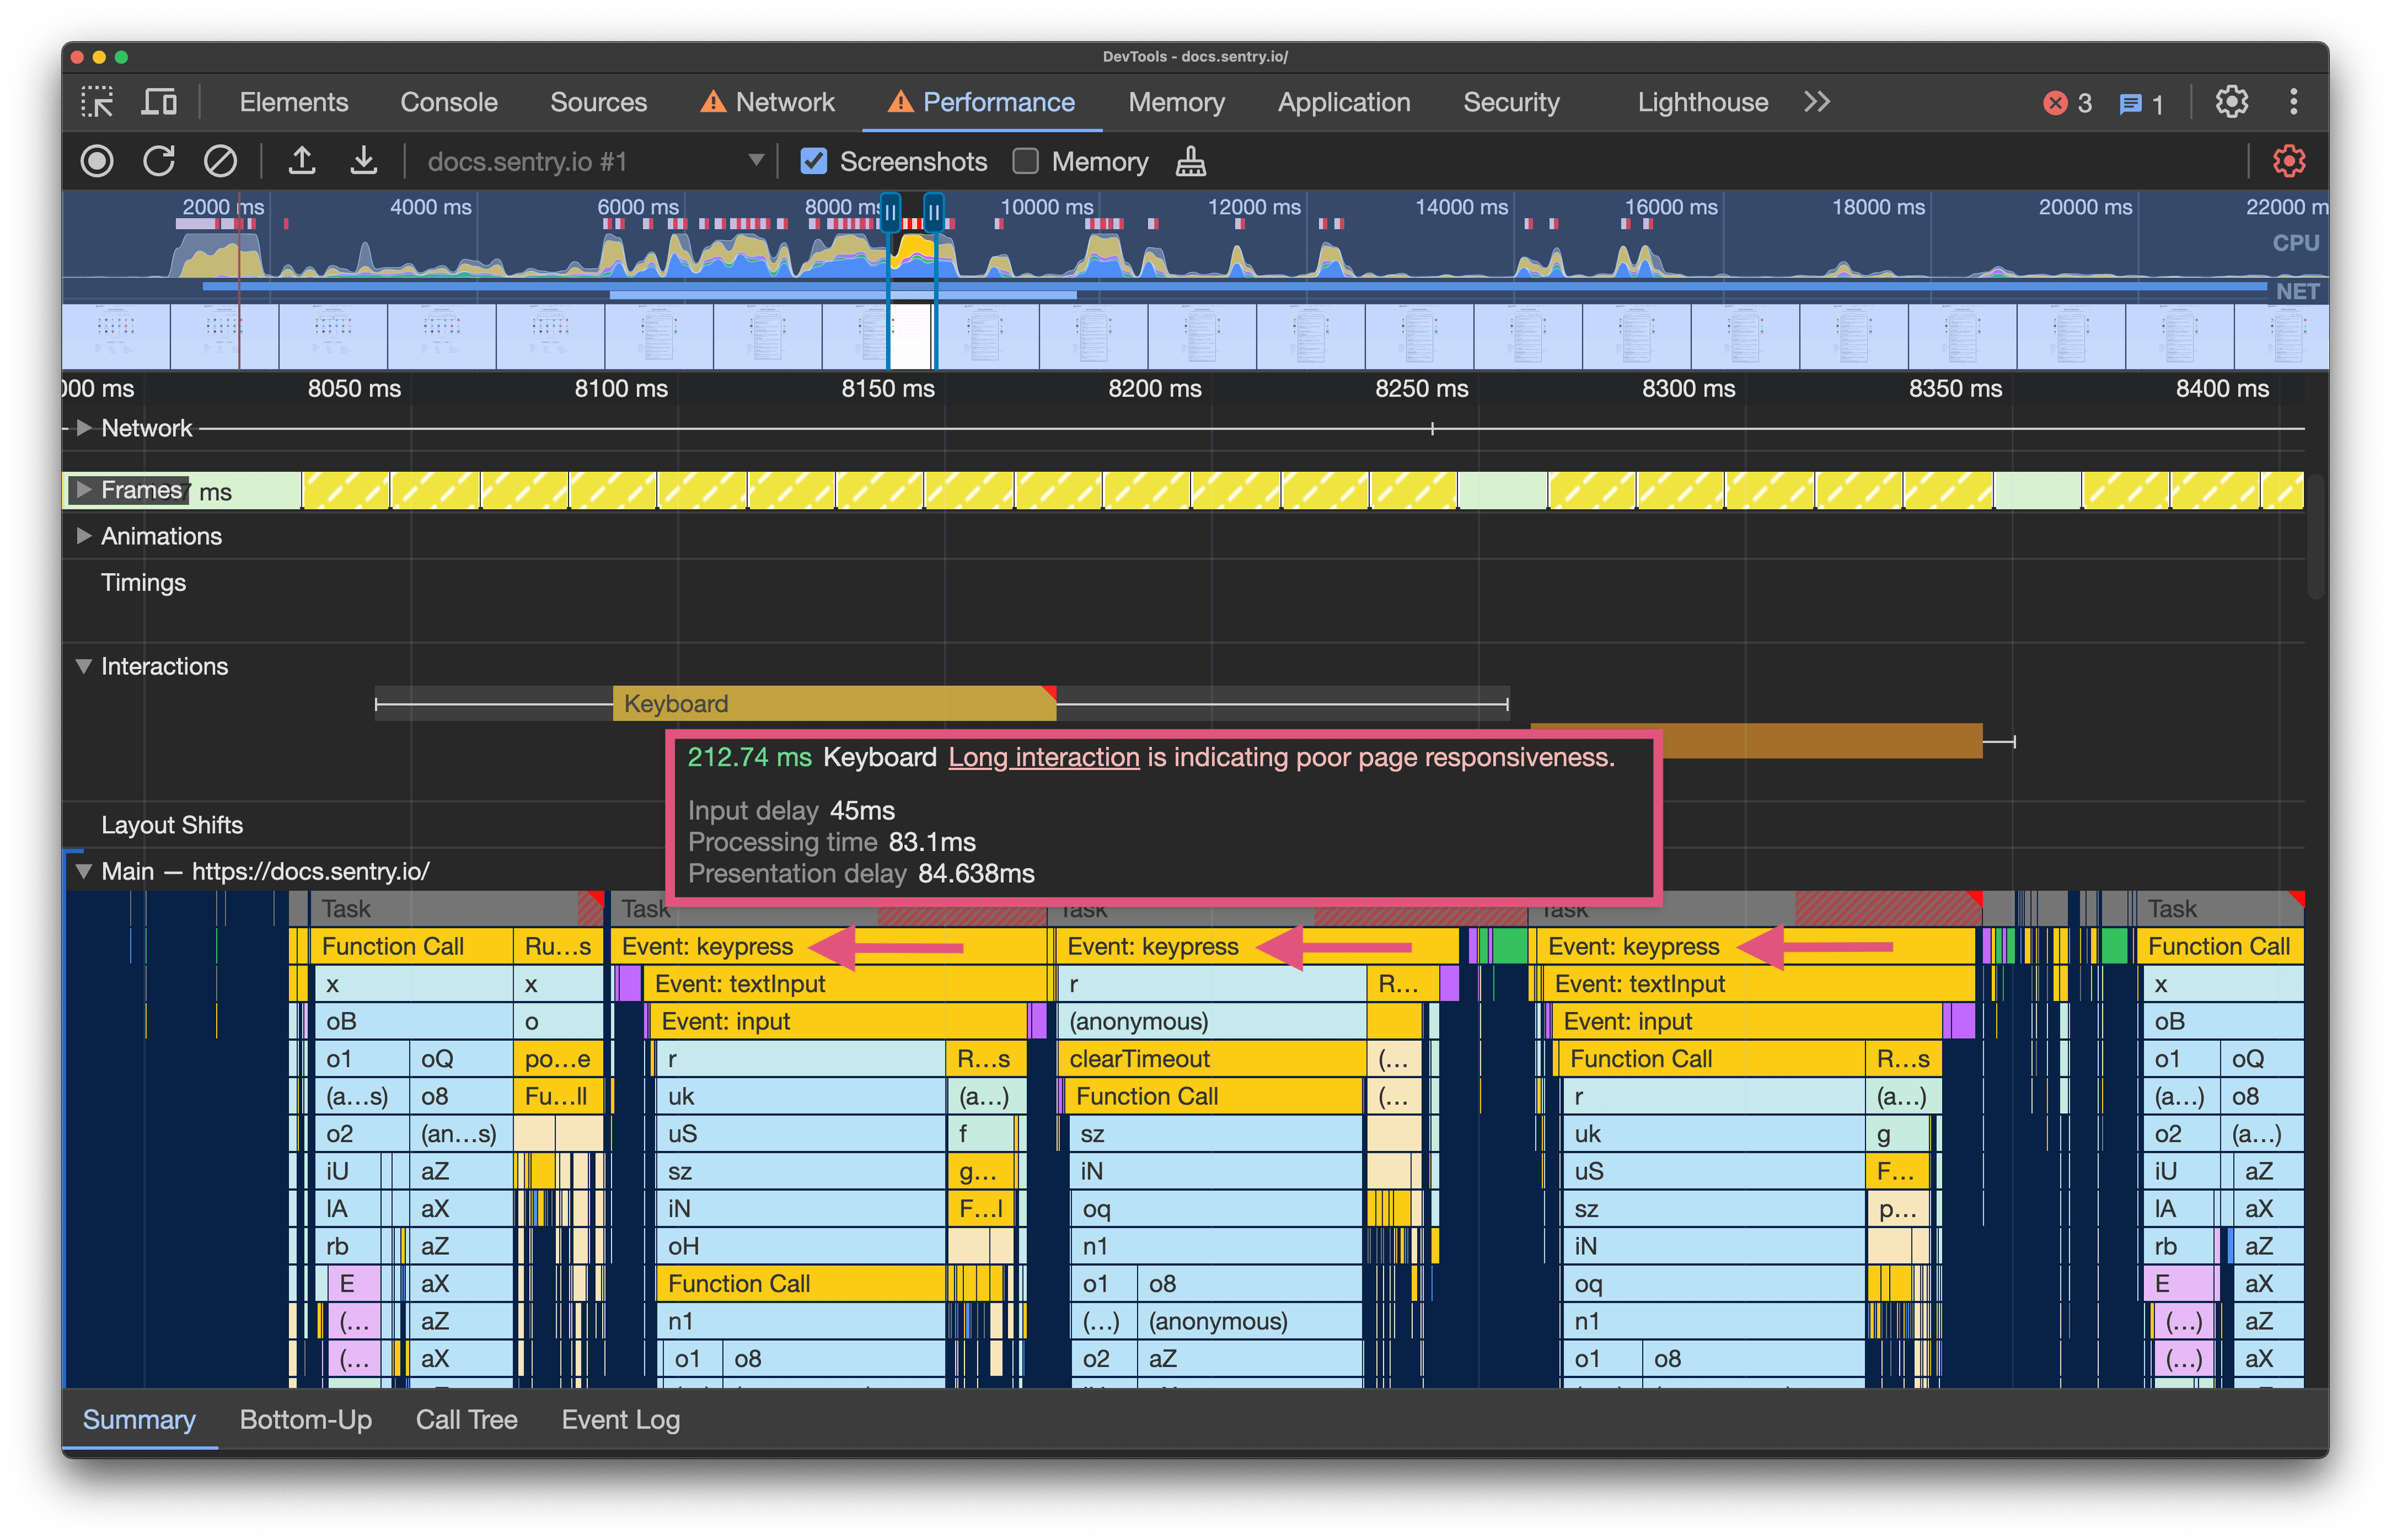
Now, let’s cross-reference the main thread activity with the interactions lane. In this example, I typed the term “web vitals” into the search input on the Sentry Docs home page. Under the task blocks on the main thread, you’ll see a number of “Event: keypress” blocks that were captured when I typed each letter. In the interactions lane, there are blocks labeled “Keyboard”, indicating when I typed. Hovering over those blocks tells us that “Long interaction is causing poor performance.”
Also notice the whiskers on either side of the blocks. These indicate that interactions are currently blocked by activity on the main thread, meaning the page might appear unresponsive. As I was typing (with CPU throttling), this unresponsiveness was obvious.
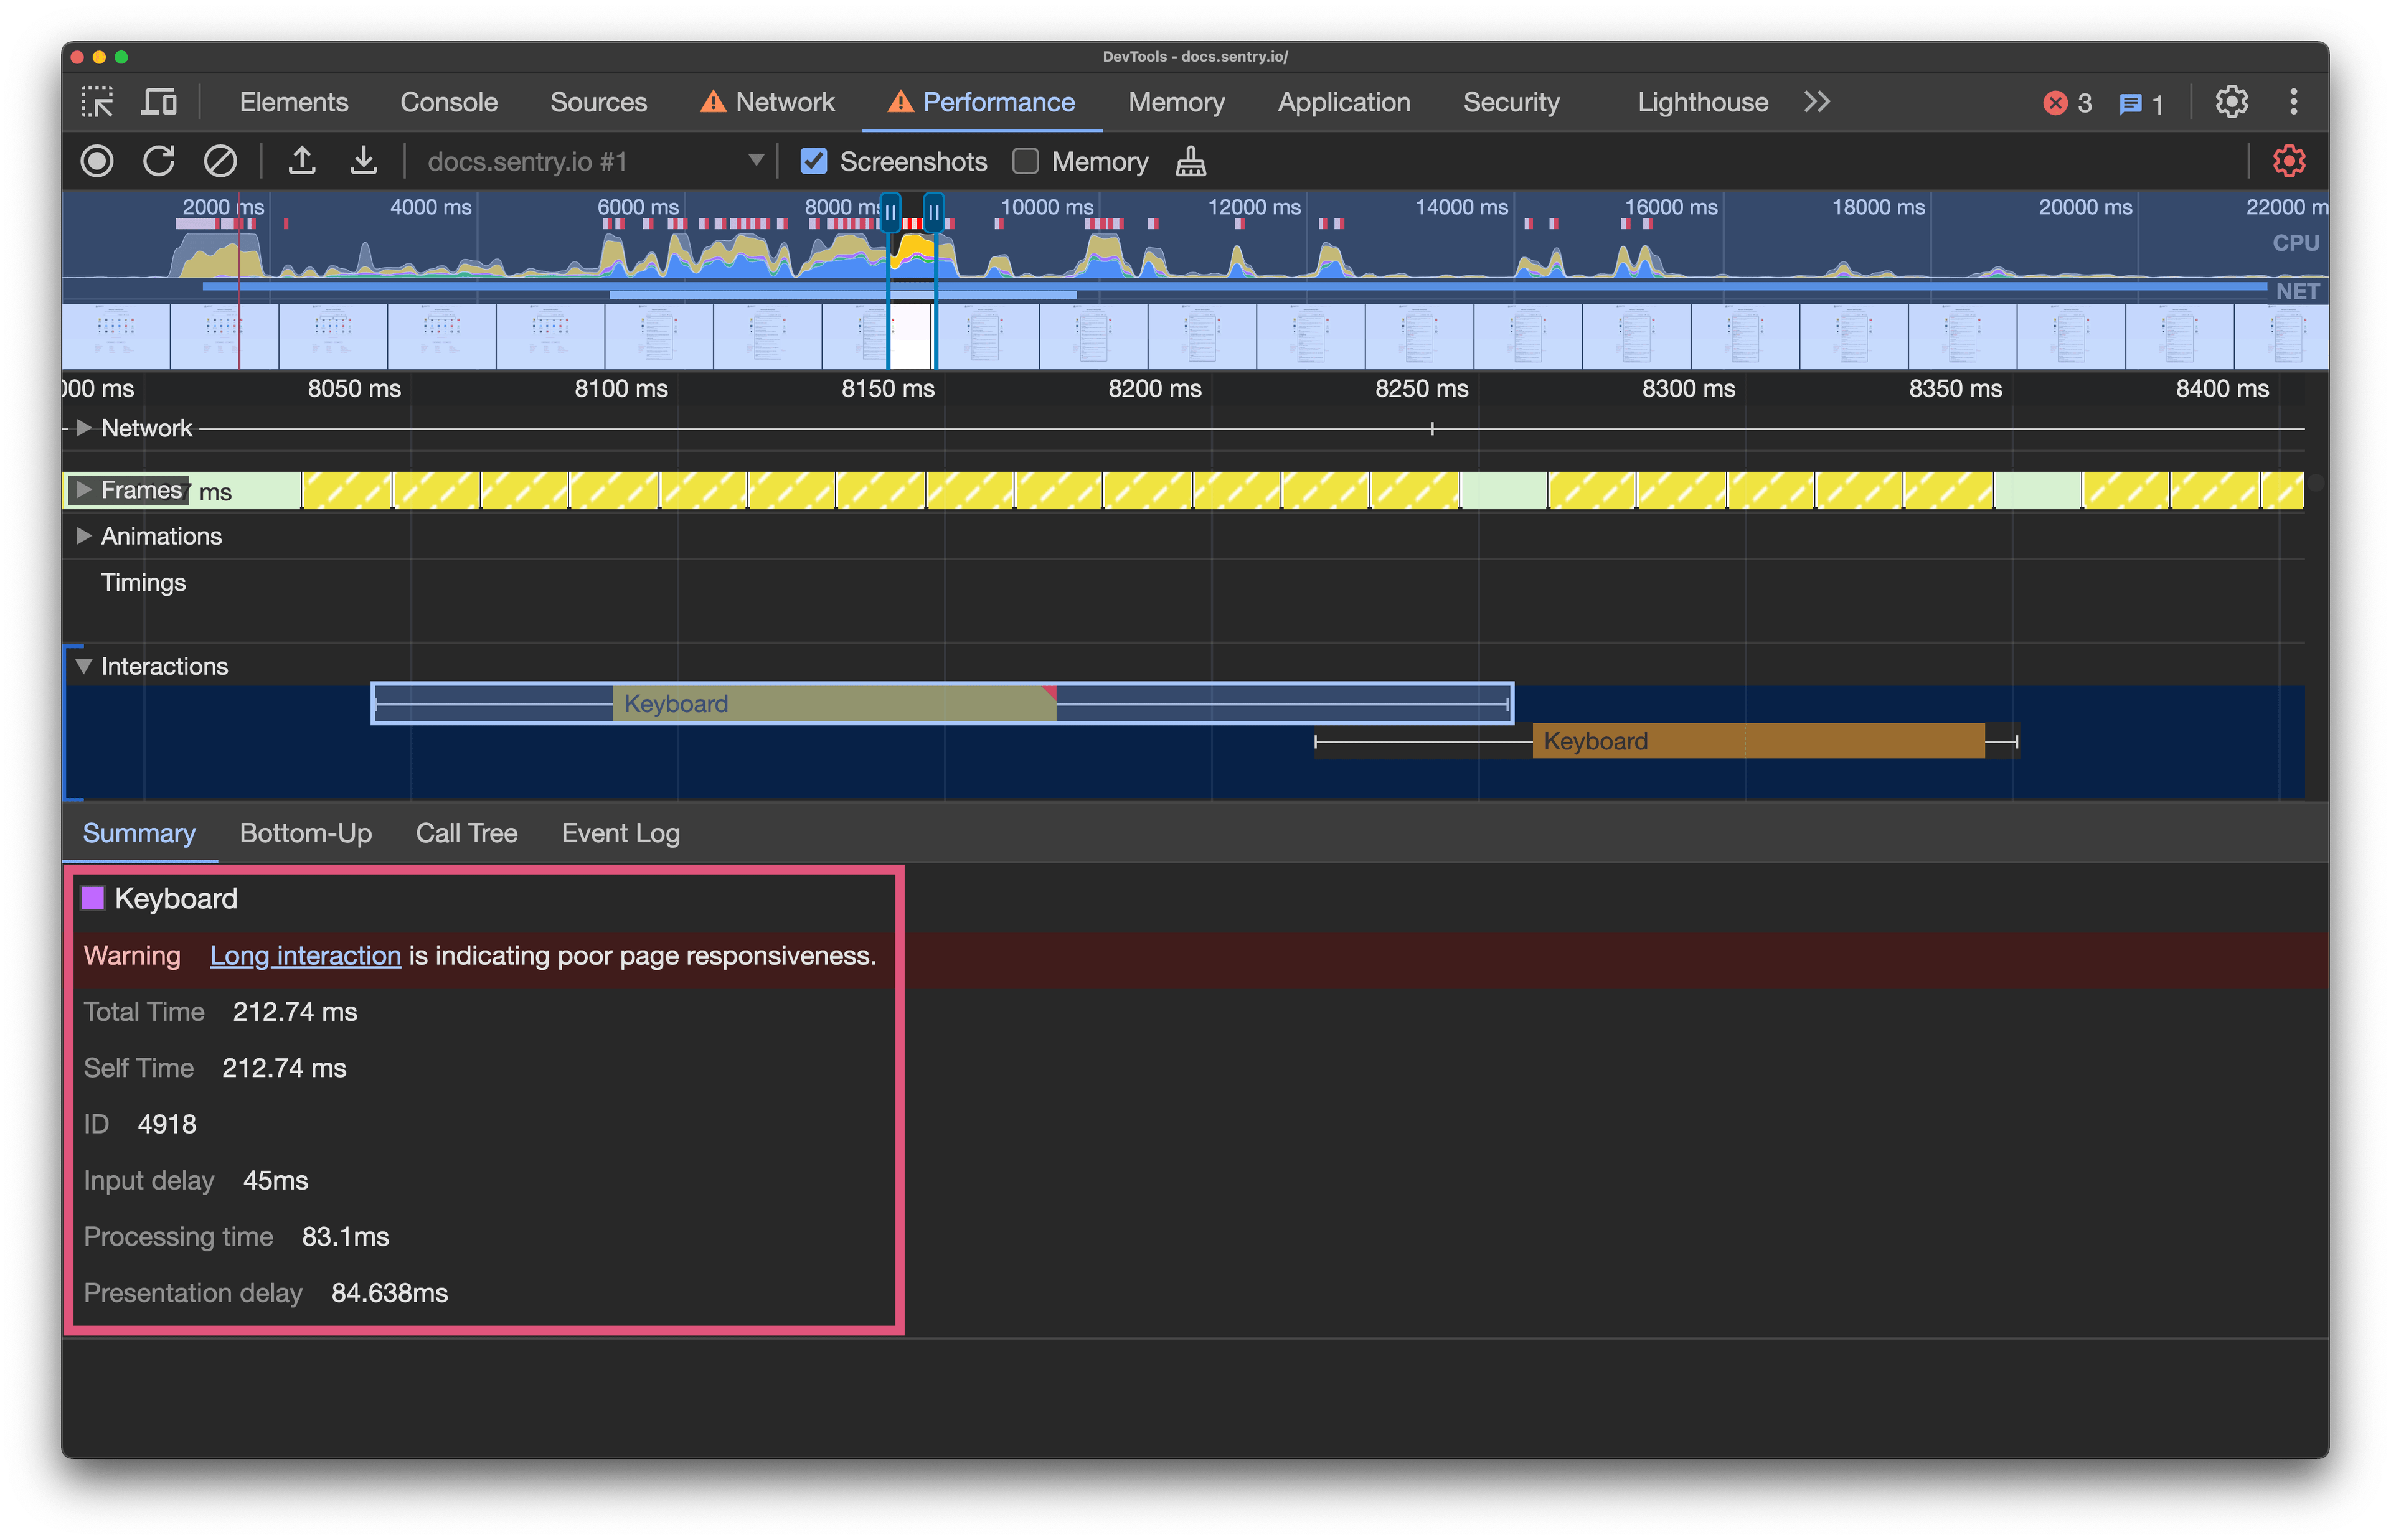
Clicking on a keyboard interaction block allows us to inspect this interaction further. The summary shows us that this interaction had an input delay of 45ms, processing time of 83.1ms, and a presentation delay of 84.638ms. The total time of the interaction took 212.74 ms.
Google states that a good INP score is equal to or less than 200ms, a poor score is greater than 500ms, and a score that needs improvement is between 200 and 500ms. Based on these benchmarks, our scores need improvement.
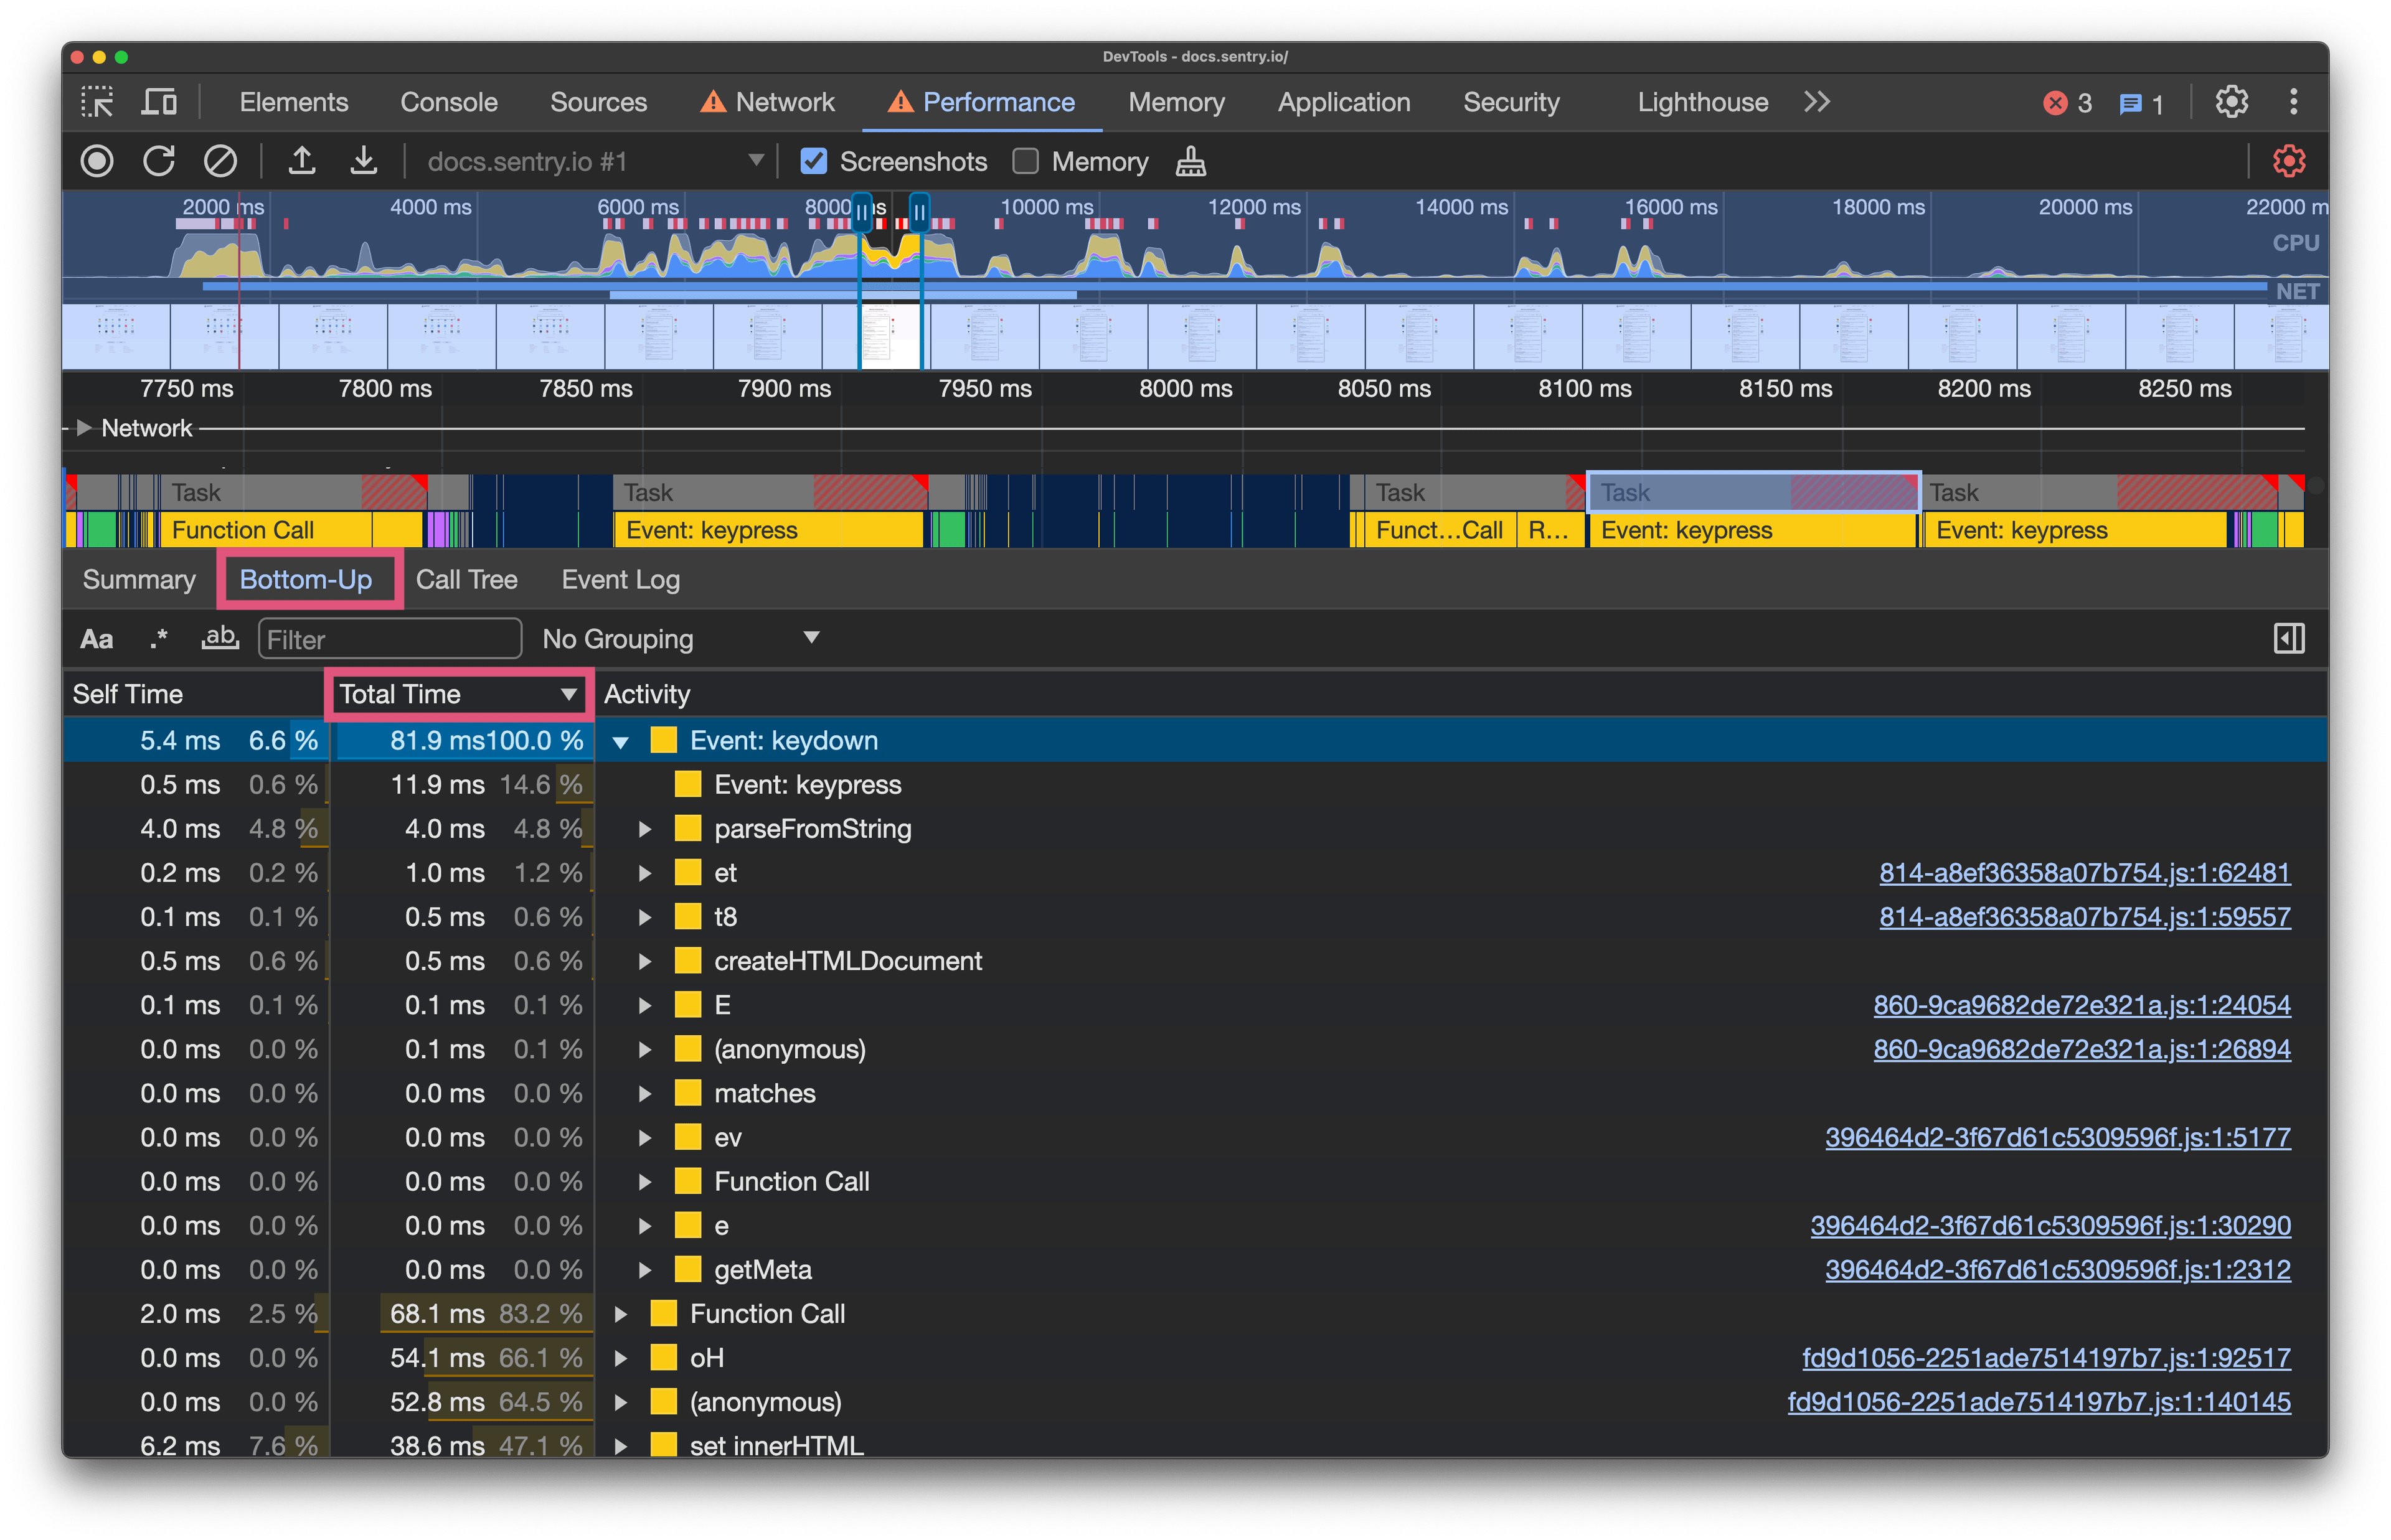
To understand which processes are taking the longest inside each task, select a task block, and click on the “Bottom-Up” tab below. This shows which activities directly took up the most time in total. Click the “Total Time” column header to sort by time ascending or descending.
Expand each event to see the full list of subsequent events and their respective execution times. Comparing this detailed list to what you thought should be happening can help you identify any anomalies.
Improving INP for your websites and apps
Now that you’re familiar with how to investigate blocking processes by cross-referencing interactions with main thread activity in development, how do you fix issues that cause bad INP scores? As usual, it depends. But here are some questions to ask yourself if you discover unexpected long-running tasks on your web pages that could affect your INP score:
Are you providing timely visual feedback? Does the next paint happen within 200ms?
Is something running when you didn’t expect it to? Can you remove that process?
Do you really need to process each user interaction individually, or can you restrict function calls via debouncing?
Could you extract the resulting function calls from the main thread and move them to a web worker?
There are also some more experimental ways to improve the perceived responsiveness of your pages, but proceed with caution because they may not be supported on all browsers.
This could be useful in situations where you have a queue of tasks to run (such as calls to an API on each keypress), and you want to give control back to the main thread regularly to allow the page to respond to further user interaction. At the time of writing, there are no published plans to make this API available in any other browser engines.
It’s still Chromium-first, so feature-detect it and keep a fallback for other browsers. Used carefully, it’s a practical way to break up long tasks that hurt INP.
A cross-browser JavaScript task scheduler
During my research for this post, I discovered main-thread-scheduling, a JavaScript task scheduler developed by Antonio Stoilkov that focuses on helping you improve perceived page performance, and therefore, your INP scores. It uses isInputPending() if available, but provides scheduling functionality for all browsers. Personally, I haven’t had a use case to test this just yet, but at first glance, it’s currently maintained and could be worth a try.
The bottom line
By replacing FID with INP, Google pushed developers to minimize delays in visual feedback across the entire user journey, not just the first interaction. That helps pages feel responsive, which can reduce friction and bounce.
The bottom line? Even when you can’t fully control how long data fetches take, a good INP score still depends on making pages feel fast, all the time.
Sentry measures Core Web Vitals, including INP, from real users so you can act on poor responsiveness in production. See Web Vitals monitoring and this overview of Web Vitals in Sentry. Questions? Find us on GitHub and Discord.
FAQs
What is INP? ▾
Interaction to Next Paint (INP) is a Core Web Vital that measures how quickly a page responds to clicks, taps, and key presses throughout a visit, not just the first interaction. A good INP is 200ms or less at the 75th percentile.
What did INP replace? ▾
INP replaced First Input Delay (FID) as a Core Web Vital in March 2024. FID only measured the input delay of the first interaction. INP covers the full interaction latency across the page lifecycle.
What is a good INP score? ▾
Google considers INP at or below 200ms good, between 200ms and 500ms as needing improvement, and above 500ms poor. Measure at the 75th percentile of page loads, split by mobile and desktop when you can.
How do I improve INP? ▾
Reduce long tasks on the main thread, give users quick visual feedback, debounce noisy handlers, move heavy work to web workers when it fits, and break up long JavaScript with yielding patterns such as scheduler.yield() (with a fallback for unsupported browsers).
Can Sentry track INP? ▾
Yes. Sentry measures Core Web Vitals, including INP, from real users so you can see which pages and interactions need work. See Web Vitals monitoring.
With Unreal Engine 5.8, your coding agent can drive the editor through Unreal MCP. The Sentry plugin adds tools and skills so it can set up Sentry, upload debug symbols, and root-cause crashes for you.
Should you use Seer or just connect the MCP to your agent? A breakdown of what Seer, the Sentry agent plugin, the CLI, and coding agent handoffs each do — and when to reach for one over the other.
Five months after launch, Seer Agent can now take action on your behalf in Sentry, and pull in infrastructure data from outside Sentry to diagnose issues faster.