Field Guide: Sentry and the Legend of Snuba Migration
Field Guide: Sentry and the Legend of Snuba MigrationWelcome to our series of blog posts about things Sentry does that perhaps we shouldn't do. Don't get us wrong — we don't regret our decisions. We're sharing our notes in case you also choose the path less traveled. In this post, we're giving context to everything that needed to happen before we introduced Snuba, our new storage and query service for event data.
As perhaps you know (from the sentence directly above), we recently introduced Snuba, the new primary storage and query service for event data that powers Sentry. Snuba, which is backed by open source column-oriented database ClickHouse, is used for search, graphs, issue details, rule processing queries, and just about every feature mentioned in our push for greater visibility. In other words, Snuba is excellent, and we're using it to power pretty much everything.
So, how did we transition from our existing storage systems to Snuba? In your mind, you might be picturing something as dramatic as the Golden Idol scene from Indiana Jones or something as simple as the flip of a switch.

We connected Snuba to Sentry in our development environment, the unit and integration tests pass, and we ran a few load tests on production hardware — at this point, we can just cut over all of the traffic from the old system to the new system, hand out some crisp high-fives, and go home, right? That would make for a good story (and a very short blog post), but in reality, the process was a lot more complex — and a lot more interesting — than that.
Migrating to Snuba was an undertaking — you could say that we were charting unexplored territory. We were creating something new, with technology that was new to us, and dealing with data that we didn't want to lose: your events! We needed to find a way to smoothly transition from the old system to the new system without compromising data integrity or performance (or being crushed by a giant rolling boulder). You'll find our solution detailed below as we explore data validation, abstractions, and risk management.
Checking our map: data capacity
Sentry users rely on Sentry to collect, store, and communicate the health of their applications. Sentry is critical to many of our user's monitoring workflows and incident response processes, so taking downtime or losing data during the transition process was not an option. Introducing Snuba to our system architecture changed the way we write and read event data, and we needed to be able to have absolute confidence that data was stored and queried correctly in Snuba before introducing it to the world.
There are several conventional approaches to ensuring that two databases are in the same state — that is, that they contain the same data. One straightforward approach is to check that all of the rows in database A also exist in database B (and have the same data), and vice versa. Unfortunately, doing this correctly generally requires that both databases are in read-only mode. We consider the inability to process and store events as downtime, so this approach wasn't an option for us.
Another approach is to deploy the change and wait for users to tell you that things "seem weird." In many other applications, users create some type of content themselves, and if that content doesn't show up, that user knows immediately and can quickly notify support staff about the issue. Sentry users don't manually send errors, and much of our query volume comes from automated systems (internal and external) that query Sentry for additional information about an issue. If the data — your events — isn't there, everything still looks fine: your application doesn't have any errors! By the time you notice, you've already lost a lot of data, and we've lost your trust — not good, and not an option for us.
A third approach is to rely on unit and/or integration test coverage. While this approach can work in the presence of a comprehensive specification and a test suite that exhaustively validates the specification, without that, even 100% test coverage means that the tests only cover the things that you knew could go wrong when the test was written. In our case, tests were often written several years before Snuba ever existed, and the specification for the system was often "it should work the way it works now, just faster and more scalable."
After considering the alternatives, we realized that our best option was to test that Snuba was returning the same results as our existing systems for the queries performed in production.
Gathering our supplies: The Service Delegator
As we described in the first installment of our series, our migration to Snuba relied on the fact that we had already defined abstract interfaces for our Search, TagStore, and TSDB (time series database) service backends. Since we already had an existing abstraction layer in place for these services, we knew the types of queries we were performing on the various systems as well as how we expected the response data to be structured.
To test that the Snuba backend was returning the same results as the existing backends for each type of query we ran, we implemented an intermediary which we called the Service Delegator. The Delegator is a class that conforms to the abstract interfaces exposed by each service, presenting the synchronous API that is expected by the calling code. In the background, the Delegator is capable of performing concurrent requests against different backends for that service. The Delegator also provides the ability to define a callback that executes when the concurrent requests complete, successfully or otherwise.
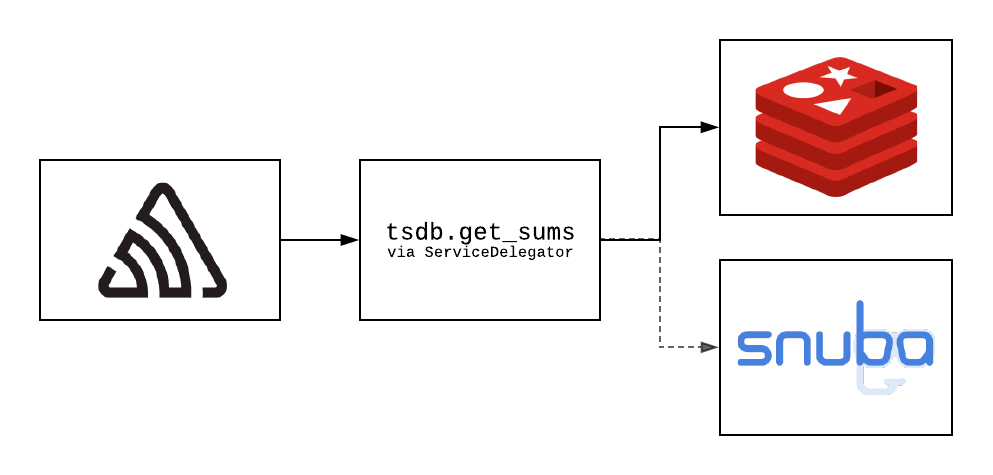
A path of an example request. The Sentry application makes a request to tsdb.get_sums via the Service Delegator, which causes concurrent requests to both Redis and Snuba. The result from Redis is returned to the caller.
In our case, the Delegator allowed us to execute queries against the existing backends while also executing those requests against the new Snuba backends. Users saw responses from the existing systems, so there was no change in performance or data integrity, regardless of the state that Snuba was in at the time. When requests to both systems were complete (or had timed out), we logged the request details (service, method name, and argument values) as well as the response and timing from both systems to Kafka.
We then implemented a Kafka consumer that processed the results, creating a "similarity score" on a 0 to 1 scale for each backend that represented the similarity or difference for each backend when compared to the result that returned to the user; 0 being totally different and 1 being the same.
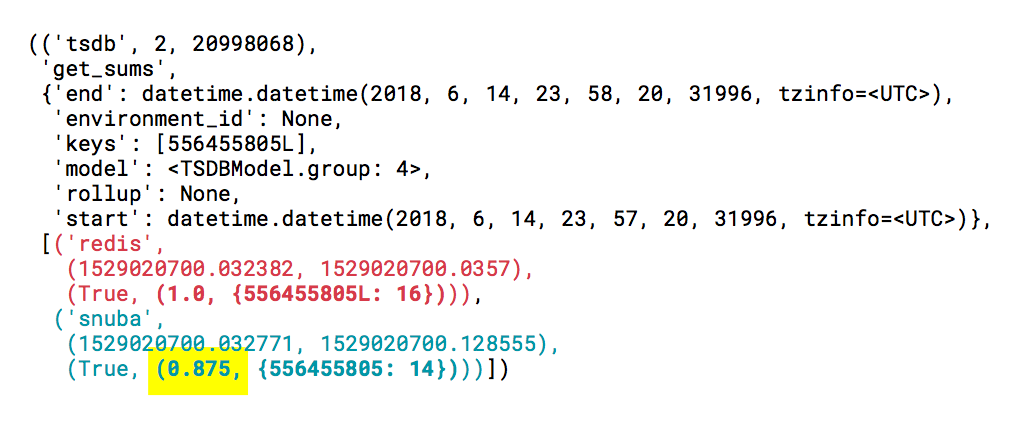
An example result logged after a request to tsdb.get_sums, which routed to two different backends, had completed and been processed by our Kafka consumer. The request timing and response data from redis, the existing implementation, is shown in red, while the request timing and response data from snuba, our new implementation, is shown in blue.
In the example above, the similarity between the responses from redis and snuba is 0.875, since 14/16 = 0.875. In addition to numeric comparisons and equality comparisons for strings and booleans, we implemented recursive comparisons for a variety of different composite data structures, including Jaccard similarity for set similarity, pairwise similarity for sequences such as lists, and keywise similarity for mappings. Those processed results were then published to a "calls" table in our ClickHouse cluster, where we stored details about the queries for later analysis.
Rechecking the map: visual aids
As you can imagine, we collected a lot of data — far too many independent data points for any human observer to make sense of without a little help. Towards the end of the development process for Snuba, we were recording 100% of requests performed by the Search, Tagstore, and TSDB services. Our first challenge was figuring out how to summarize and visualize the data in a way that enabled us to understand how the system was performing.
Our first attempt at visualizing the system behavior was to create similarity histograms for each service and method, grouping each of the similarity values to a tenth (a value of 0.85 would be aggregated alongside all values greater than or equal to 0.8 and less than 0.9). The histograms gave us an overview of which methods were commonly returning more accurate results and which methods needed improvement.
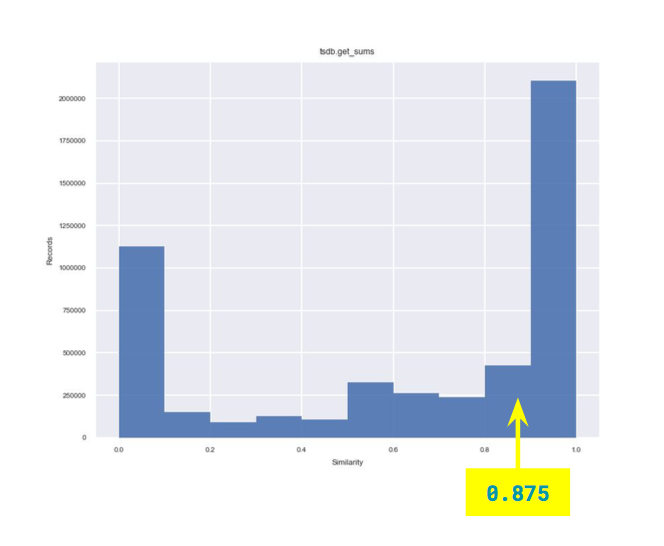
You can see where our 0.875 data point introduced above falls in the overall similarity distribution for the tsdb.get_sums method.
Having a "big picture" view of how similar each query type was to the baseline result allowed us to focus our efforts on those areas where we'd be able to make the most significant improvement early on. Since we were recording data about each request performed, we were able to focus on those requests with exceptionally low similarity scores for each method. Having access to the parameters and response data for each request allowed us to hone in on what specifically was causing the inconsistencies. Once a fix was applied, we could replay the request with the original parameters to verify that any inconsistencies were no longer present.
While we could plot new histograms every day to get a point-in-time snapshot of query performance over the past 24 hours, this didn't provide a visual indicator of how significantly our changes were improving result similarity over time. A common approach for showing the relationship between two numeric variables — in our case, time and similarity — is to use a scatter plot. However, in our case, we had far too many data points to generate a useful plot.
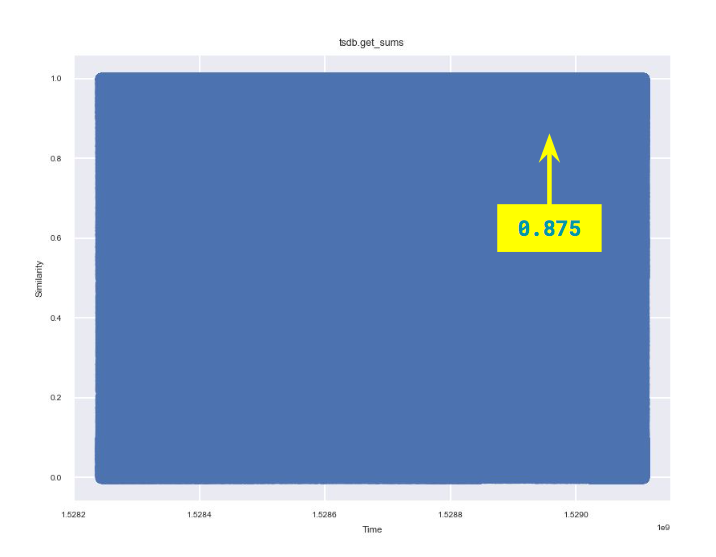
Scatterplots are often useful when dealing with relatively small amounts of data, but we plotted so many results that the visual noise of the plot covered any meaningful signal.
To reduce the amount of distinct data plots that we were required to plot, we borrowed an technique from the histogram approach and created "heat maps" where we binned data points into daily segments on the X-axis and binned each tenth of the similarity scale (as we did in the histogram plots) on the Y-axis, resulting in a grid display. The cell shading intensity corresponded to the number of data points in that similarity bin each day. As more data was written to Snuba and improvements were made, the scores trended upwards, as in the example below.
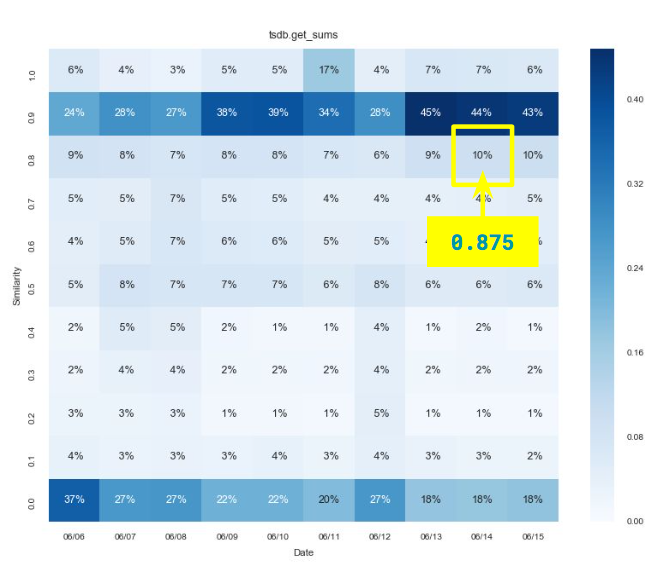
Binning (aggregating) data together allowed us to get a lower resolution and a better overview of how the system was performing in three dimensions: time, similarity, and frequency/density.
A quick detour: finding race condition
Most of our generated histograms and heat maps followed a typical pattern: result similarity generally clustered around a single mean. However, there were a few methods, mostly in our TSDB calls (like the example above), that followed a bimodal distribution: a significant subset of the results was entirely dissimilar, while another subset of the results was very similar, and just a few of the results fell somewhere between. Why?
Since we logged the method arguments as part of the Service Delegator payload, we identified commonalities in the query structures and mapped those back to the call sites in the Sentry codebase. In our case, the accurate results were coming from the web UI/API, while the inaccurate results were coming from our post-processing workers that check alert rules, send emails and webhooks, integrate with plugins, etc. Weird.
Remember that we introduced Apache Kafka into our processing pipeline. Writes to Snuba were performed through Kafka, while writes to our existing systems initiated through our existing processing pipeline, which utilized RabbitMQ and Celery.
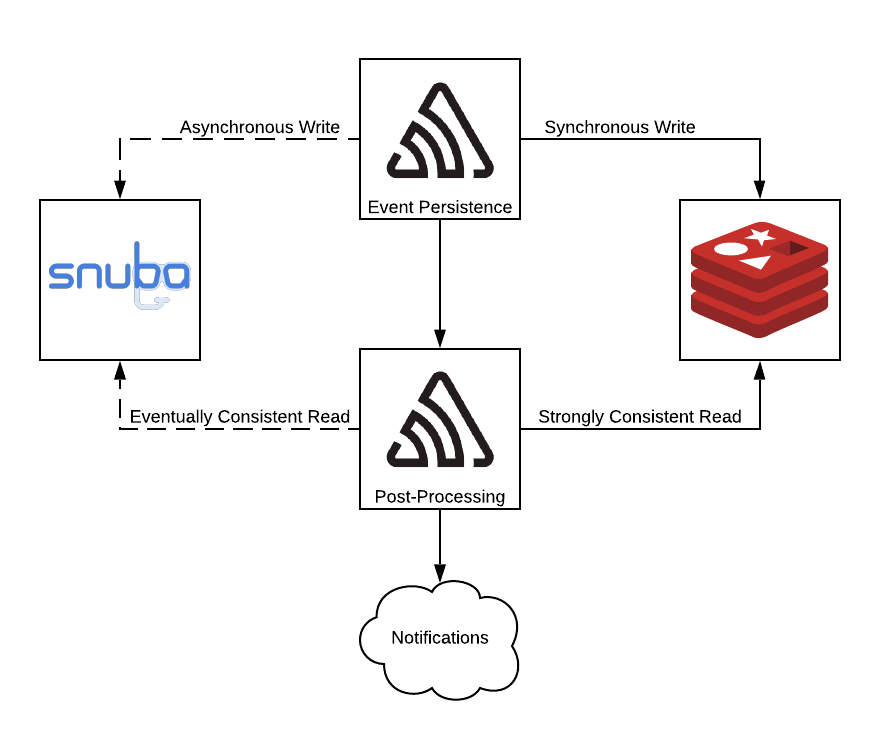
These results depicted an implicit sequencing dependency between our write path and our post-processing code; our post-processing tasks relied on data being present in our TSDB backend to make decisions about whether or not to send emails, etc. In our previous architecture, everything happened sequentially: data was guaranteed to have been written to the database before post-processing occurred.
With the introduction of Kafka, this was no longer the case. Sometimes, the write happened before the data was written, and sometimes, the read happened before the data was written. The window of inconsistency between the two different processing paths was small, but it did exist — we were playing a game of chance, and we had been drawing the short straw a lot of the time.
Without this issue identification, our alerting decisions rely on incorrect data and lead to false negatives in the alerting system. Sure, users are happy about receiving fewer alert emails... until they realize the reason why.
Could we have avoided this? Defining, modeling, and testing complex system interactions is hard, and it's not realistic to expect any engineer (or team of engineers) to have a comprehensive understanding of a large and continually evolving software system. Some academics have spent their whole careers creating frameworks for formally specifying the relationships between systems, resulting in tools such as TLA+.
Similarity, our test suite, would have never caught this (without exercising full end-to-end system tests where all assumptions are explicitly stated), and casual testing by loading the UI would have never uncovered this problem. Weeks would have likely gone by before we would have been made aware of the issue. Through our validation process, we were able to identify, understand, and implement a solution to the problem (more on the fix in an upcoming post) before it ever became an actual problem.
Back on the path: increasing similarity
By the time we were ready to release Snuba to users, many of our graphs had results solidly in the "very similar" range, with most results in the 0.9 to 1.0 range.
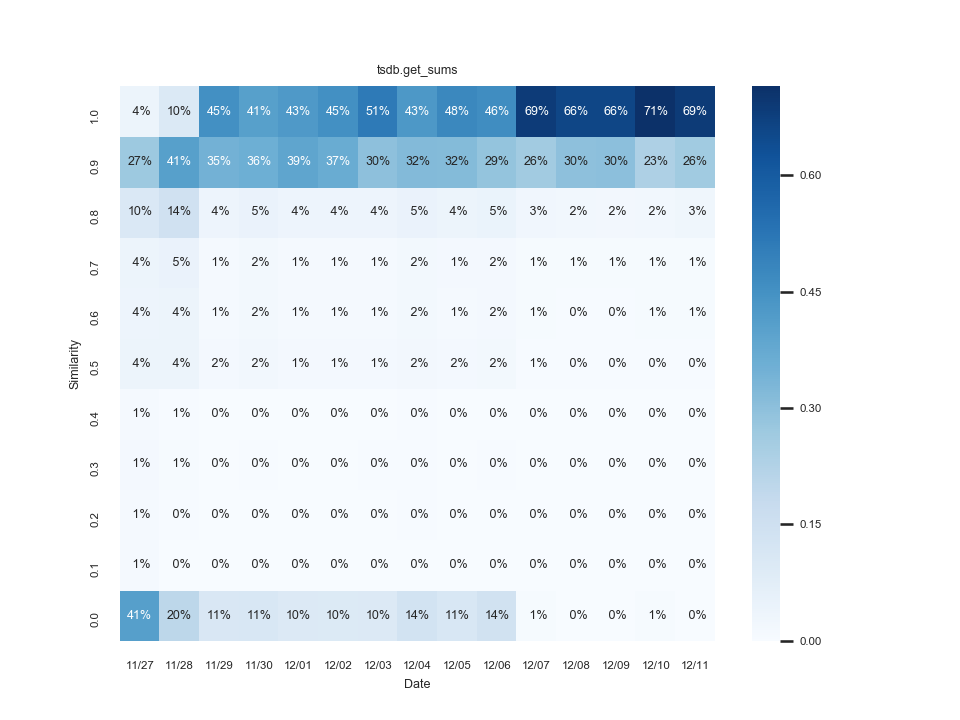
Results improved over time as we fixed bugs, and more data was recorded in the new system. Note the dramatic jump in similarity scores between 11/27 and 11/29, as well as between 12/06 and 12/07.
Beginning our final ascent: performance
We also needed to ensure Snuba's performance was up to snuff before turning it on for users. Ultimately, our performance concerns included ensuring we were ready to handle our typical throughput (queries per second) and minimizing the maximum latency. After all, no one wants to suffer through a very embarrassing incident with their brand new database melting down on launch day.
Trekking throughput pass
Even in the cloud, code runs on computers. We have a finite amount of CPU, IOPS, network bandwidth, and memory. So, how do we know that we have enough resources to serve and sustain our production traffic?
We often underestimate capacity planning and load estimation in their difficulty and complexity — the behavior and impact of a single user are different than a thousand, or even a million, concurrent users. Different "shapes" of queries have different performance characteristics, and using different parameters in those same types of queries can lead to very different database behavior. A query that returns one row can have wildly different performance characteristics and resource needs than a query that returns thousands of rows. Getting representative results from synthetic benchmarking requires a deep understanding of your data, your users, and their query patterns.
With a new product, this can be very challenging. Luckily for us, we already knew the type of queries performed, as they were the same queries we were already running. No fancy modeling needed.
The Service Delegator enabled us to choose backends used at runtime so that we could load test Snuba with production traffic. Our approaches varied from simple random sampling, where we'd mirror (dual or "dark read") some percentage of read requests to Snuba, to more complicated approaches. By using method arguments as part of our routing logic, we could sample requests based on specific parameter values we were interested in, such as organization and project.
As we increased Snuba's query volume, we tuned database settings and modified queries to learn more about how ClickHouse performed in our production environment. Sometimes things got weird. When it did, we were able to quickly shed load by reducing the number of queries that we were sending to Snuba and investigate.
Turbulence settled, and we continued to increase the percentage of dark reads until we were completely dual reading. The gradual switch enabled our operations team to test failure scenarios, fail-overs, and administrative changes, all with the production load and none of the production risk.
Circumnavigating latency peak
At this point, we were confident our new system could sustain traffic without falling over, but that's a pretty low bar. No one talks about how good their database is just because it doesn't crash all the time, the same way most people don't talk about how great their car is just because it isn't continuously breaking down. Fast cars are cool. Fast databases are cool, too. Not only did our database need to be reliable, it needed to be responsive — at least as responsive as the systems we were replacing, but ideally faster.
But, what does "faster" mean? You can't measure databases in horsepower, torque, or quarter-mile times. Just as we discussed regarding throughput, performance varies wildly based on the types of queries you are running, how many of them, etc. You can record the latency (time to execute) for each operation, though, and collect data (as in, millions of data points). Then you have to make sense of it, much like we did with similarity metrics.
Remember that we recorded this data collected by the Service Delegator to ClickHouse so that we could run analytical queries on performance results. Fortunately for us, this is ClickHouse's sweet spot. A good first step to making sense of the data was segmenting latency metrics by query type — in our case, this was the service name and method name. We could collect many summary statistics over the time series data (quantiles, etc.) to get a big-picture view of how each type of query was performing.
For example, here are some of our earliest recorded percentile latencies (in milliseconds) from both Snuba as well as the existing implementation, for two different backend methods: the tsdb.get_sums method that we have been discussing, as well as our search query method:
SELECT
service,
method,
backend,
quantilesTDigest(0.1, 0.25, 0.5, 0.75, 0.9, 0.99, 0.999, 0.9999)(latency)
FROM
(
SELECT
service,
method,
result.backend AS backend,
result.finished - result.started AS latency
FROM calls
ARRAY JOIN results AS result
PREWHERE ((service = 'tsdb') AND (method = 'get_sums')) OR ((service = 'search') AND (method = 'query'))
WHERE (timestamp >= toDateTime('2018-06-01 00:00:00')) AND (timestamp < toDateTime('2018-07-01 00:00:00')) AND (result.status = 'success')
)
GROUP BY
service,
method,
backend
ORDER BY
service ASC,
method ASC,
backend ASC
┌─service─┬─method───┬─backend─┬─quantilesTDigest(0.1, 0.25, 0.5, 0.75, 0.9, 0.99, 0.999, 0.9999)(latency)────────┐
│ search │ query │ django │ [9,10.072143,14.000142,22.4104,46.338917,245.62929,1451.022,14110.52] │
│ search │ query │ snuba │ [9,14.236866,318.90396,898.8089,1933.143,5109.053,11343.897,26576.285] │
│ tsdb │ get_sums │ redis │ [2,4,16.857067,22.000584,26,101.8303,315.3288,630.6095] │
│ tsdb │ get_sums │ snuba │ [85.08794,112.36586,173.66483,320.28018,659.66565,2261.0413,4681.7617,7149.7617] │
└─────────┴──────────┴─────────┴──────────────────────────────────────────────────────────────────────────────────┘
4 rows in set. Elapsed: 3.507 sec. Processed 54.95 million rows, 7.26 GB (15.67 million rows/s., 2.07 GB/s.)In addition to general backend performance numbers, we could also more importantly directly compare the performance of the Snuba backend relative to the other backends for the exact same query parameters:
SELECT
    service,
    method,
    baseline,
    quantilesTDigest(0.1, 0.25, 0.5, 0.75, 0.9, 0.99, 0.999, 0.9999)(delta)
FROM
(
    SELECT
        service,
        method,
        arrayJoin(arrayFilter((i, backend, status) -> ((backend != 'snuba') AND (status = 'success')), arrayEnumerate(results.backend), results.backend, results.status)) AS i,
        results.backend[i] AS baseline,
        (result.finished - result.started) - (results.finished[i] - results.started[i]) AS delta
    FROM calls
    ARRAY JOIN results AS result
    PREWHERE ((service = 'tsdb') AND (method = 'get_sums')) OR ((service = 'search') AND (method = 'query'))
    WHERE (timestamp >= toDateTime('2018-06-01 00:00:00')) AND (timestamp < toDateTime('2018-07-01 00:00:00')) AND (result.backend = 'snuba') AND (result.status = 'success')
)
GROUP BY
    service,
    method,
    baseline
ORDER BY
    service ASC,
    method ASC,
    baseline ASC

┌─service─┬─method───┬─baseline─┬─quantilesTDigest(0.1, 0.25, 0.5, 0.75, 0.9, 0.99, 0.999, 0.9999)(delta)──────────┐
│ search  │ query    │ django   │ [0.99999994,3.9999998,294.45166,862.1716,1889.8358,5007.304,10545.031,20998.865] │
│ tsdb    │ get_sums │ redis    │ [72.01277,98.31285,157.48724,302.669,637.8906,2227.7224,4567.0786,6490.905]      │
└─────────┴──────────┴──────────┴──────────────────────────────────────────────────────────────────────────────────┘

2 rows in set. Elapsed: 5.640 sec. Processed 54.95 million rows, 7.26 GB (9.74 million rows/s., 1.29 GB/s.)
Initial results were (shockingly) bad; we knew that this was going to be a challenge since the existing backend implementations had been carefully and cleverly optimized over several years and we were working with systems that were new to us. Having both aggregate and point data allowed us to identify and isolate areas to improve performance, as well as evaluate broader changes, such as ClickHouse configuration or cluster topology changes.
As we made performance improvements, we routinely checked to see if query latency was reduced, similarly to how we monitored changes in result similarity. By the time we launched, Snuba response times were often equivalent to or faster than the existing systems for most of the methods we were replacing.

We were able to improve the performance of many queries over several months of iteration and experimentation, as shown in these recorded latency distributions from our search backend. In this example, the cyan bars are from some of our earliest recorded latencies, while the orange bars are latencies near launch day. Note that the X-axis is scaled logarithmically — that’s a lot of improvement!
X marks the spot: launch "day"
After months of work and iterative improvement, things were looking good — our data was accurate, we'd been running at 100% throughput for several weeks, and we were comfortable with the latency distributions we were recording. The Service Delegator allowed us to swap primary and secondary backends at runtime while also allowing us to continue dual-writing to the old systems for a period in case we had to revert quickly.
By the time we were at 100%, nobody had noticed, and that's good. Infrastructure is probably not a place to work if you like excitement in your work — no action movie sequences here, at that point it was just another ordinary day at the office, with a few extra high fives.
We made it to the end (and so did you)
Yes, we took a big (big) risk. We also took many (many) precautions to avoid disaster.
We gained operational experience by running this for months in production before ever being visible to end-users. After all, the best way to test a system is to test it. With the help of good interface abstractions and the Service Delegator, we tested and launched without user impact. Collecting mountains of data gave us visibility into the new system relative to the old ones, allowed us to focus our efforts, observe the effects of the changes we were making, and gain confidence in the new system before launching, making launch day practically a non-event.

