Not everything that breaks is an error: a Logs and Next.js story
Not everything that breaks is an error: a Logs and Next.js story


Stack traces are great, but they only tell you what broke. They rarely tell you why. When an exception fires, you get a snapshot of the moment things went sideways, but the context leading up to that moment? Gone.
That's where logs come in. A well-placed log can be the difference between hours of head-scratching and a five-minute fix. Let me show you what I mean with a real bug I encountered recently.
Protecting an AI-powered Next.js endpoint from bots
I've been working on WebVitals, a Next.js application powered by AI. You enter a domain, and it runs a series of tool calls to fetch performance data, then uses an AI agent to parse the results and give you actionable suggestions for improving your web vitals.
On the frontend, I'm using the AI SDK's useChat hook to handle the conversation:
const { messages, input, handleInputChange, handleSubmit, error } = useChat({
  fetch: customFetch,
  api: "/api/chat",
  onError: (error) => {
    Sentry.captureException(error, {
      extra: { /* additional context */ }
    });
  },
});
The /api/chat endpoint is a standard Next.js API route, which means anyone can hit it from anywhere. Since each request costs money (OpenAI isn't free), I needed some protection against bots and malicious actors trying to spike my bill.
Vercel has a neat solution for this: bot protection via their checkBotId function. It looks at the incoming request and determines if it's coming from a bot. Simple, effective, and no CAPTCHAs asking users to identify crosswalks.
import { checkBotId } from "@vercel/functions/oidc";

export async function POST(req: Request) {
  const { isBot } = await checkBotId(req);

  if (isBot) {
    return new Response("Access denied", { status: 403 });
  }

  // ... rest of the handler
}
A production bug that only affected Firefox and Safari
Everything worked perfectly in local development. Deployed to production, tested in Chrome. Still perfect. Then I opened Firefox.
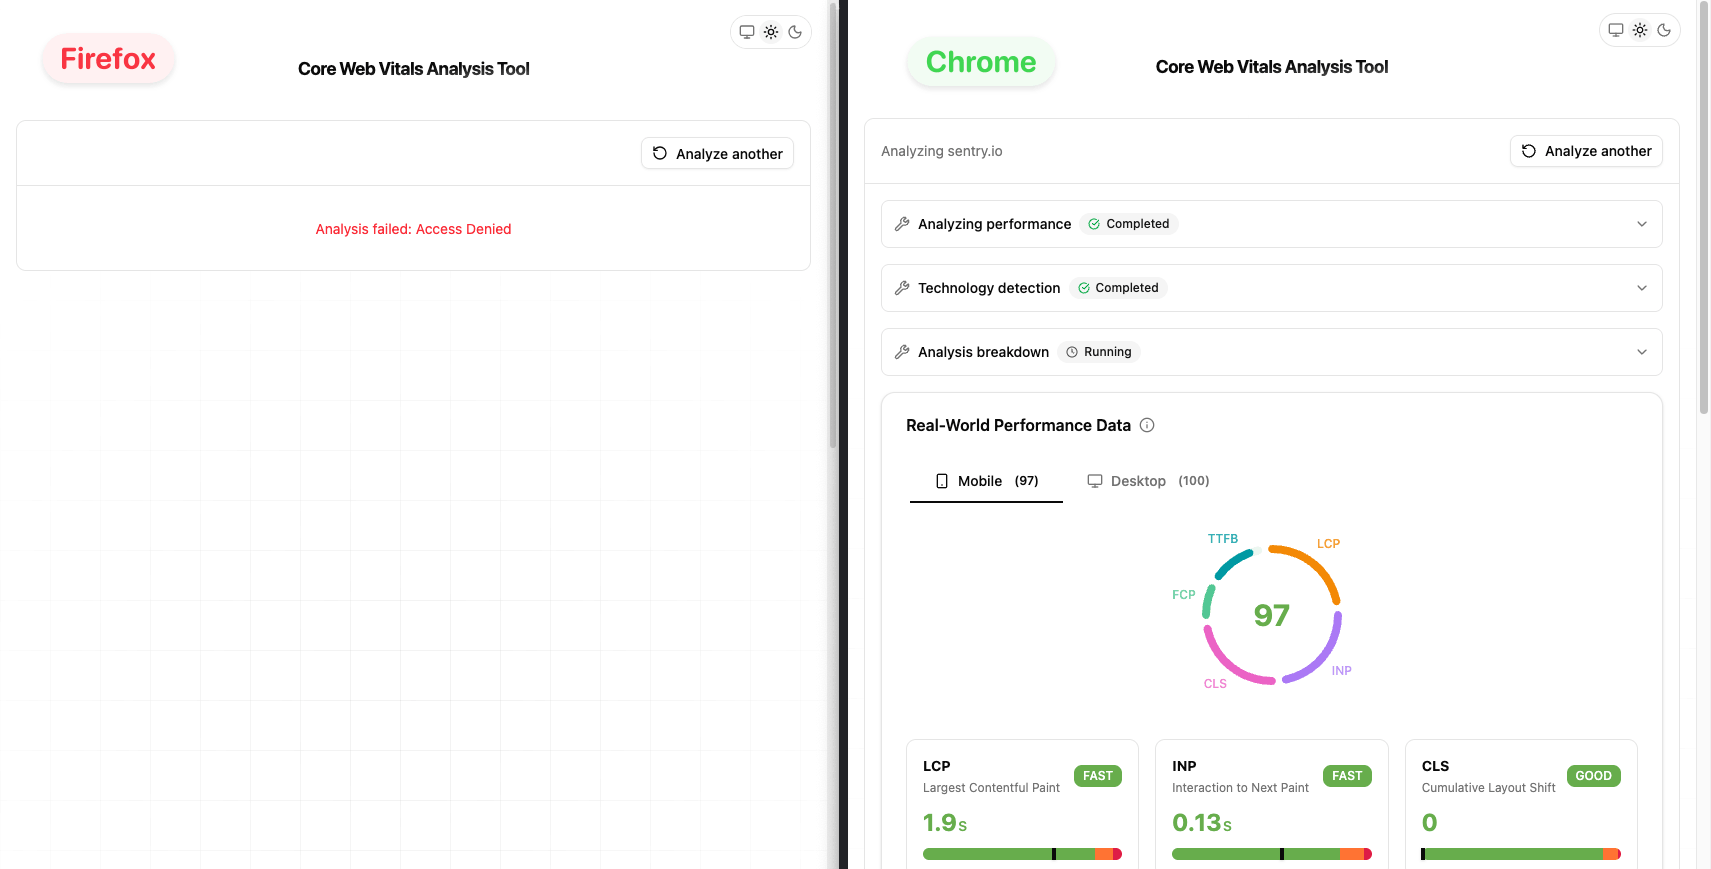
"Access denied." The same request that worked in Chrome was getting blocked in Firefox. Safari had the same issue.
I checked Sentry. The error was showing up across multiple browsers, but only Firefox and Safari were affected. Chrome users were fine.
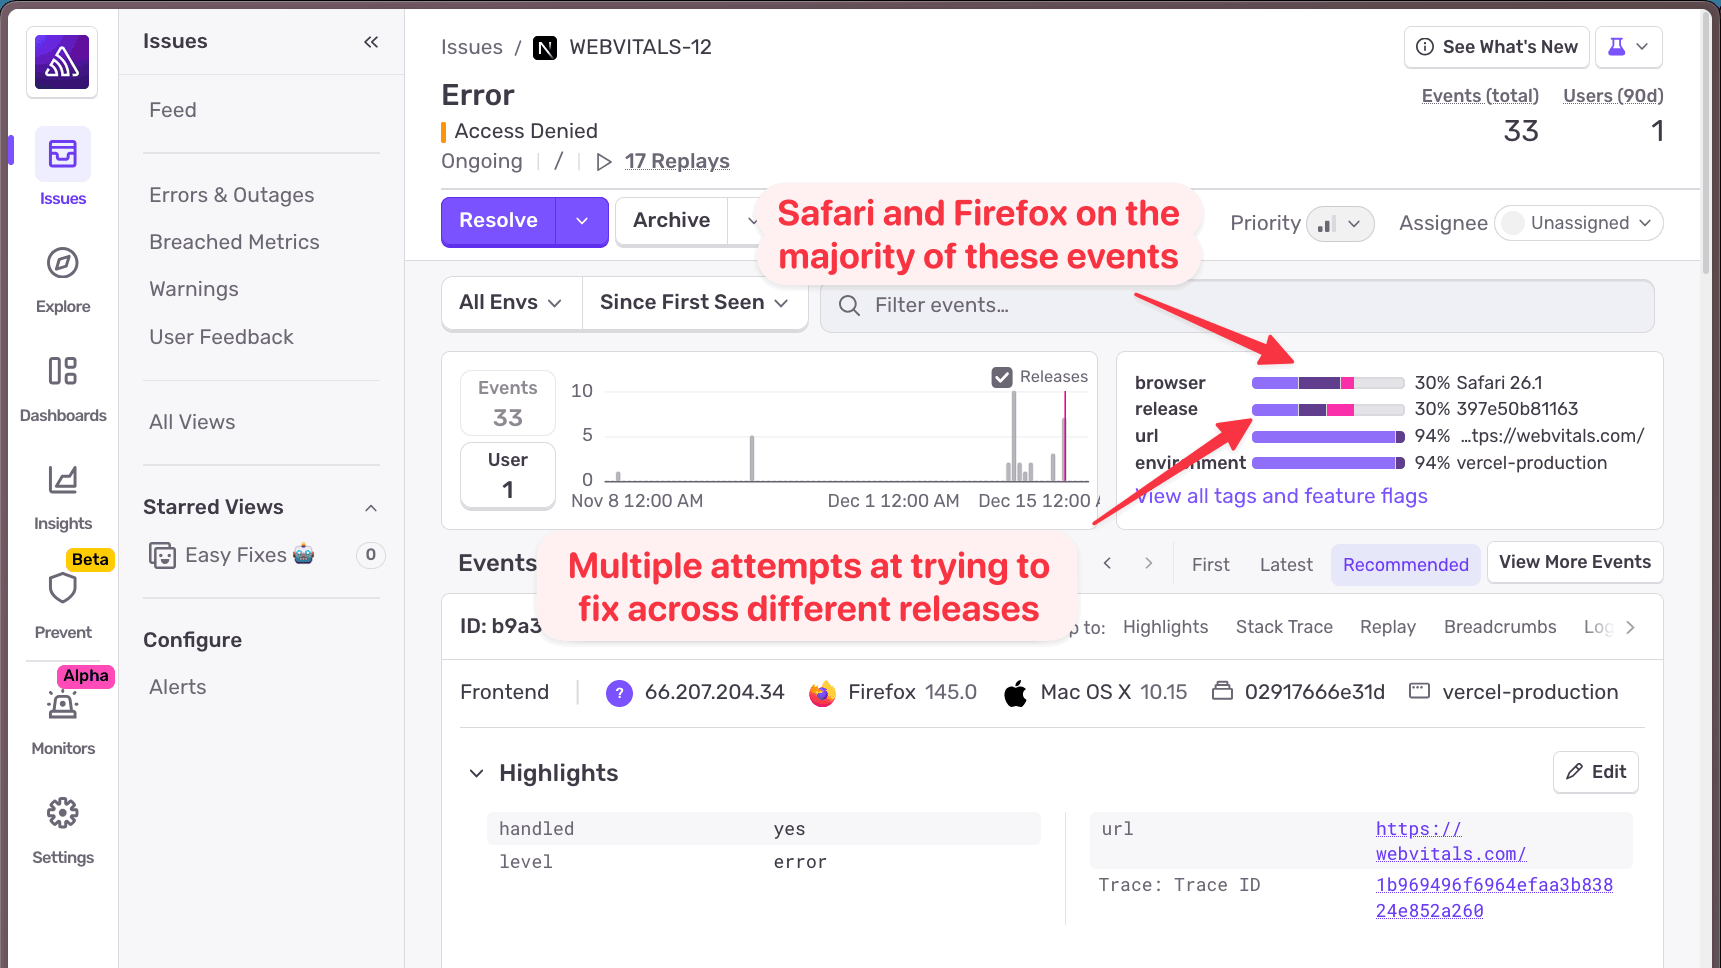
I tried fixing it. Multiple releases, multiple attempts. The error kept coming back. The stack trace wasn't helpful, it just showed me that the bot check was returning true for these browsers. But why would Firefox and Safari be flagged as bots when Chrome wasn't?
The stack trace couldn't answer that question.
Adding logs to capture the missing context
This is the kind of problem where you need more context than an error alone can provide. I needed to see what data the checkBotId function was working with when it made its decision.
So I added a log:
import * as Sentry from "@sentry/nextjs";

const { isBot } = await checkBotId(req);
const userAgent = req.headers.get("user-agent") ?? "unknown";

Sentry.logger.info("Bot ID check result", {
  isBot,
  userAgent,
});

if (isBot) {
  return new Response("Access denied", { status: 403 });
}
Nothing fancy. Just log the bot check result along with the user agent string that was passed to the function. Bot protection typically works by examining the user agent, so this seemed like the right data to capture.
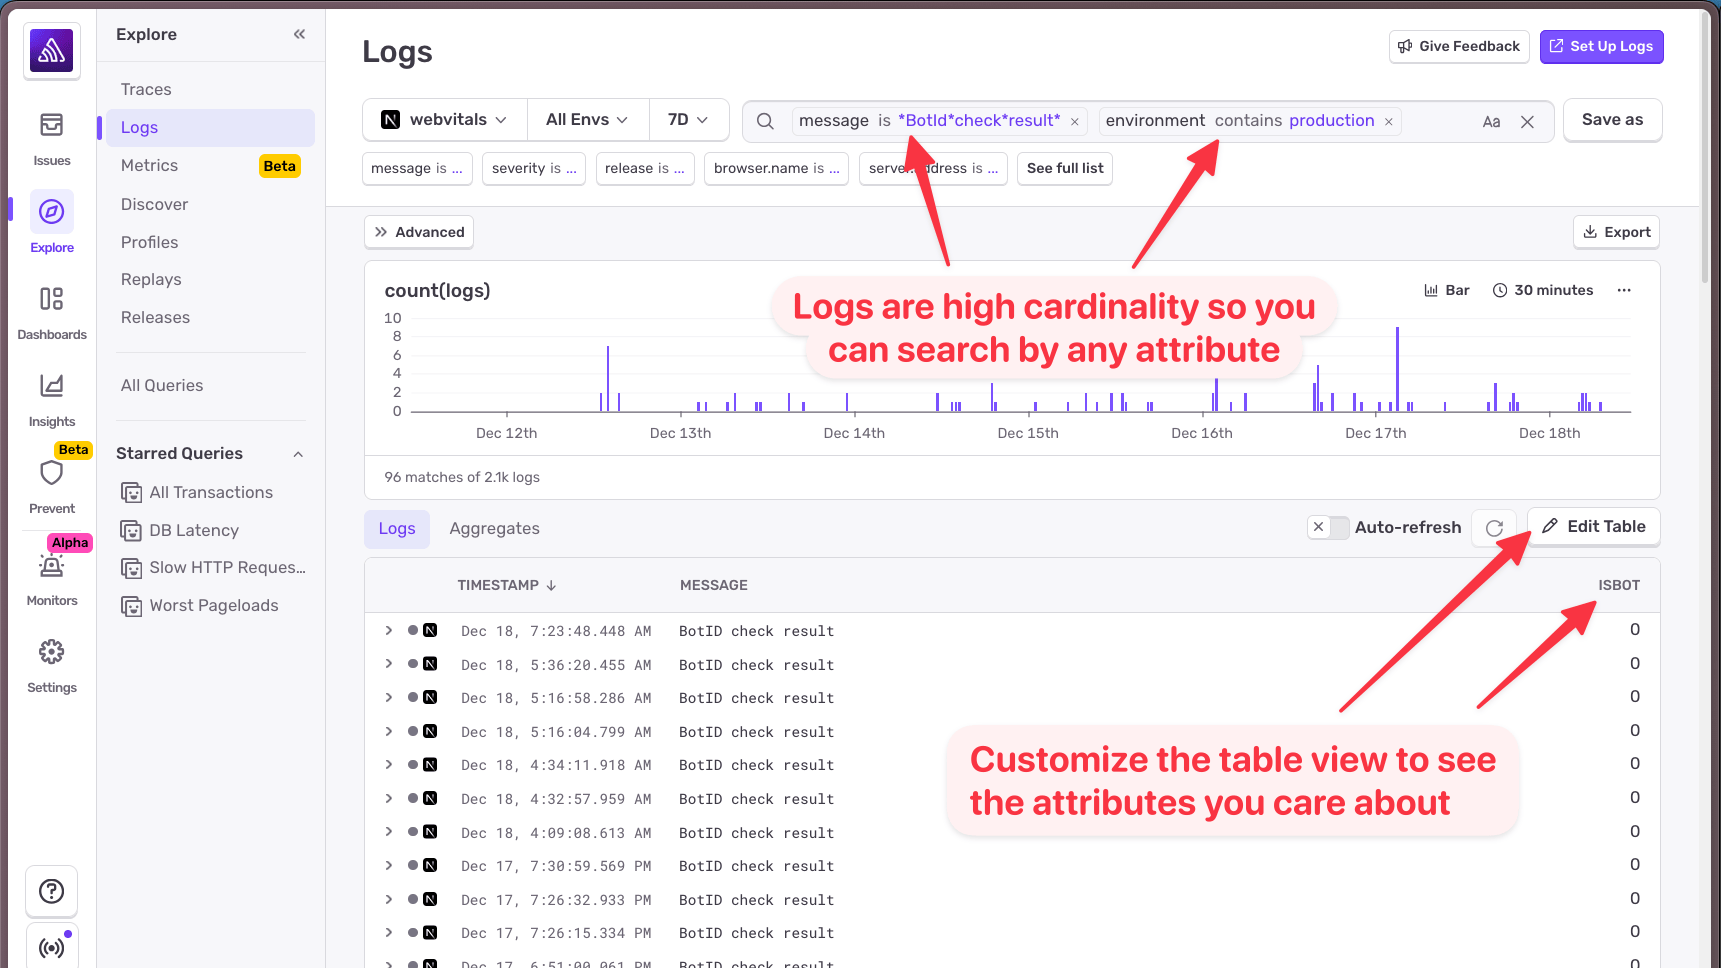
The key here is that Sentry logs are high-cardinality. You can pass any attributes you want, and you'll be able to search and filter by them later. No need to decide upfront which attributes are "important". Just log what might be useful and let Sentry handle the rest.
Using Sentry Logs to identify the root cause
With logs in place, I headed over to Sentry's Logs view and searched for my "Bot ID check result" messages. I added the isBot attribute as a column so I could quickly scan the results. (In Sentry, boolean values show as 0 for false and 1 for true.)
I found a request that passed the bot check: isBot: 0. Looking at the details, the user agent was exactly what you'd expect: a standard Chrome user agent string.
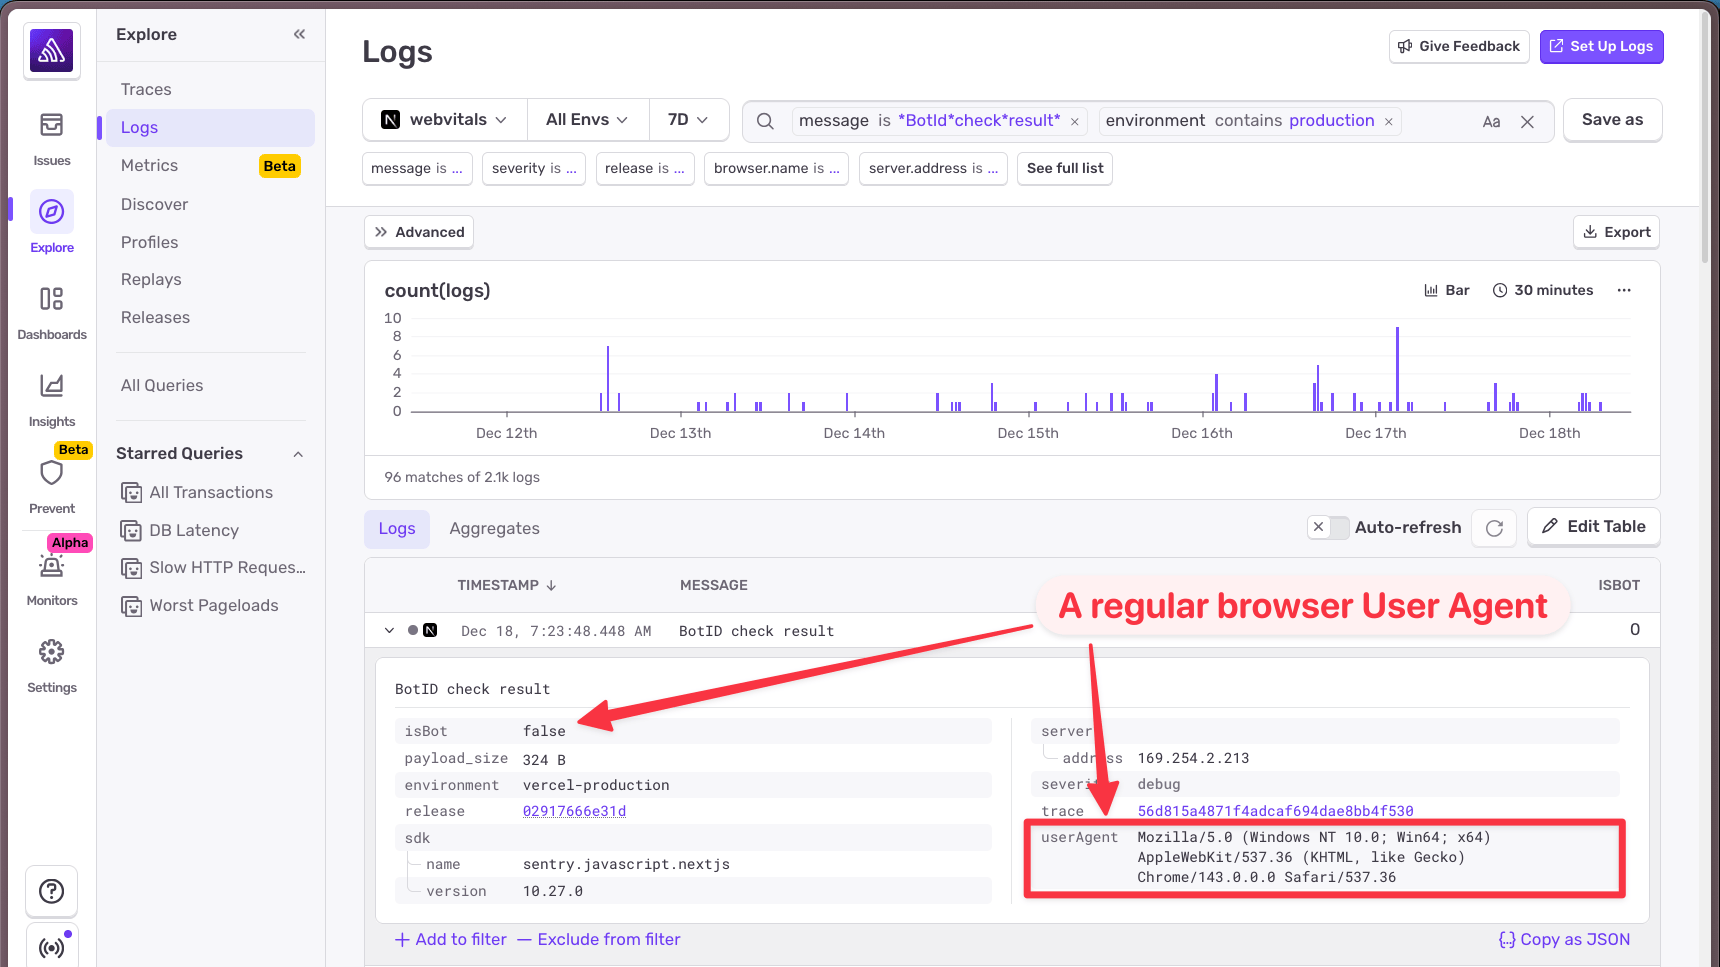
Then I looked at a request that failed: isBot: 1. The user agent was... not what I expected.
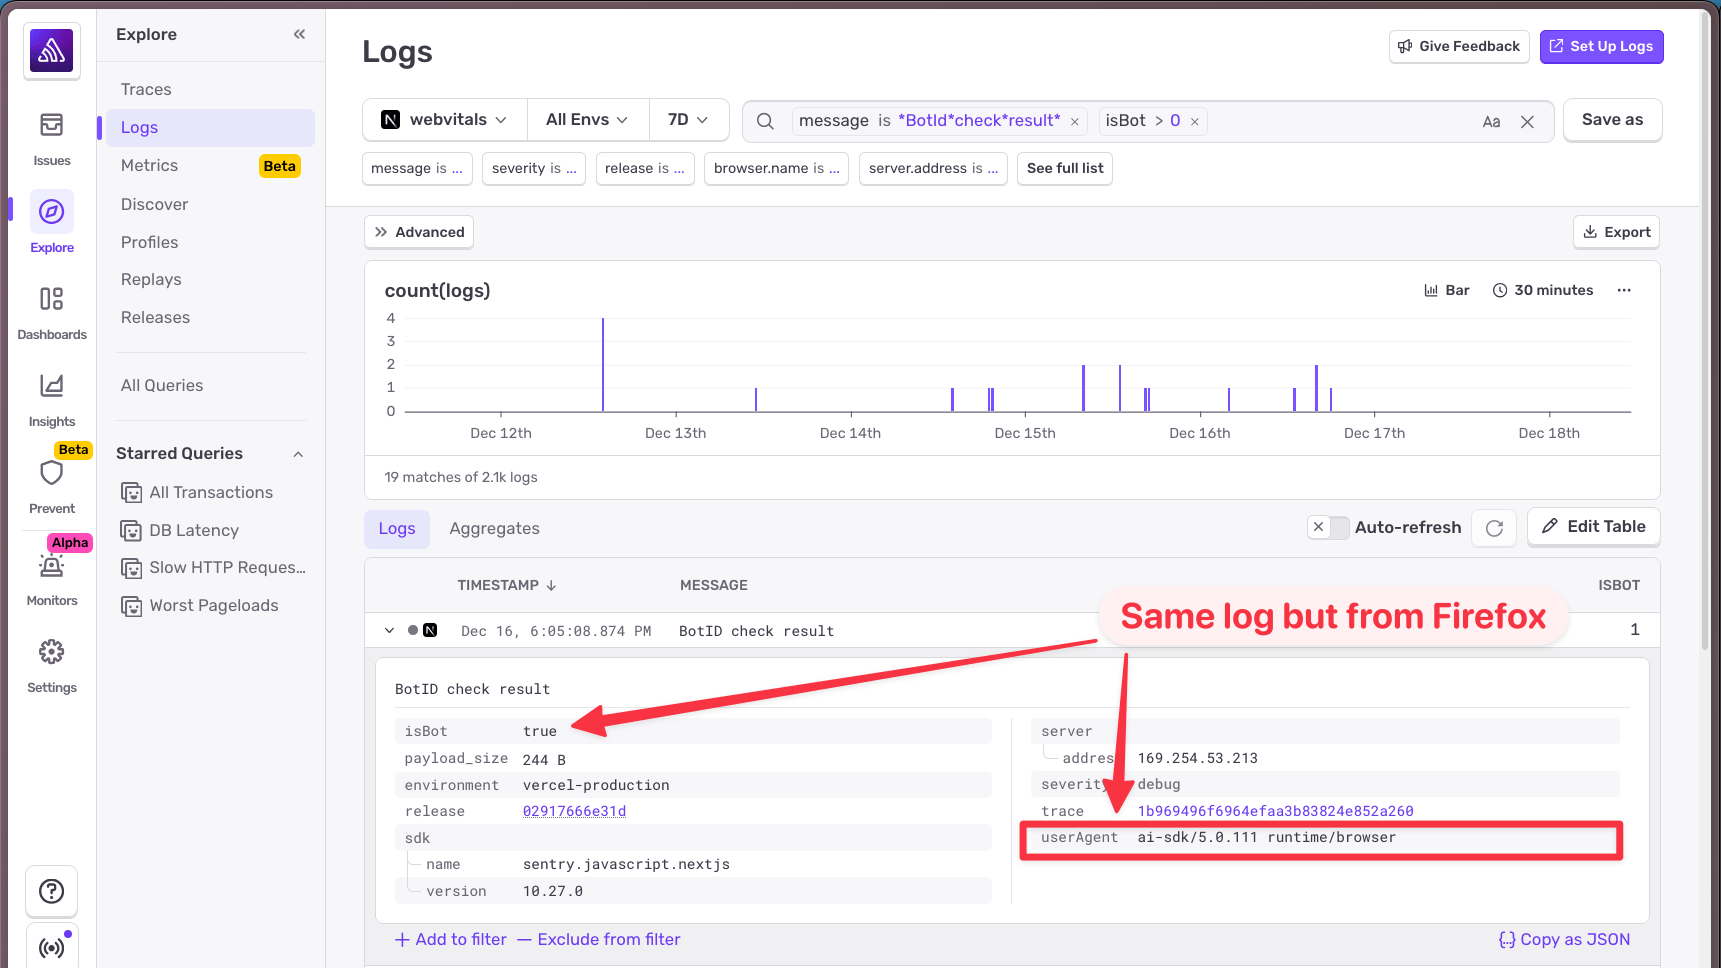
Instead of the browser's user agent, I was seeing ai-sdk. The AI SDK was sending its own user agent string instead of the browser's.
This explained everything. When the AI SDK makes requests to the backend, it uses its own user agent. Vercel's bot protection sees ai-sdk and thinks, reasonably, that it's not a real browser. Bot detected. Access denied.
But why only Firefox and Safari? Because something in how those browsers (or my setup in those browsers) was causing the AI SDK's user agent to be used instead of the browser's. Chrome happened to pass through the correct user agent.
To confirm my hunch, I used Sentry's trace connection feature. Everything in Sentry is linked by trace, so I could navigate from the log entry back to the full trace view and see the broader context of the request.
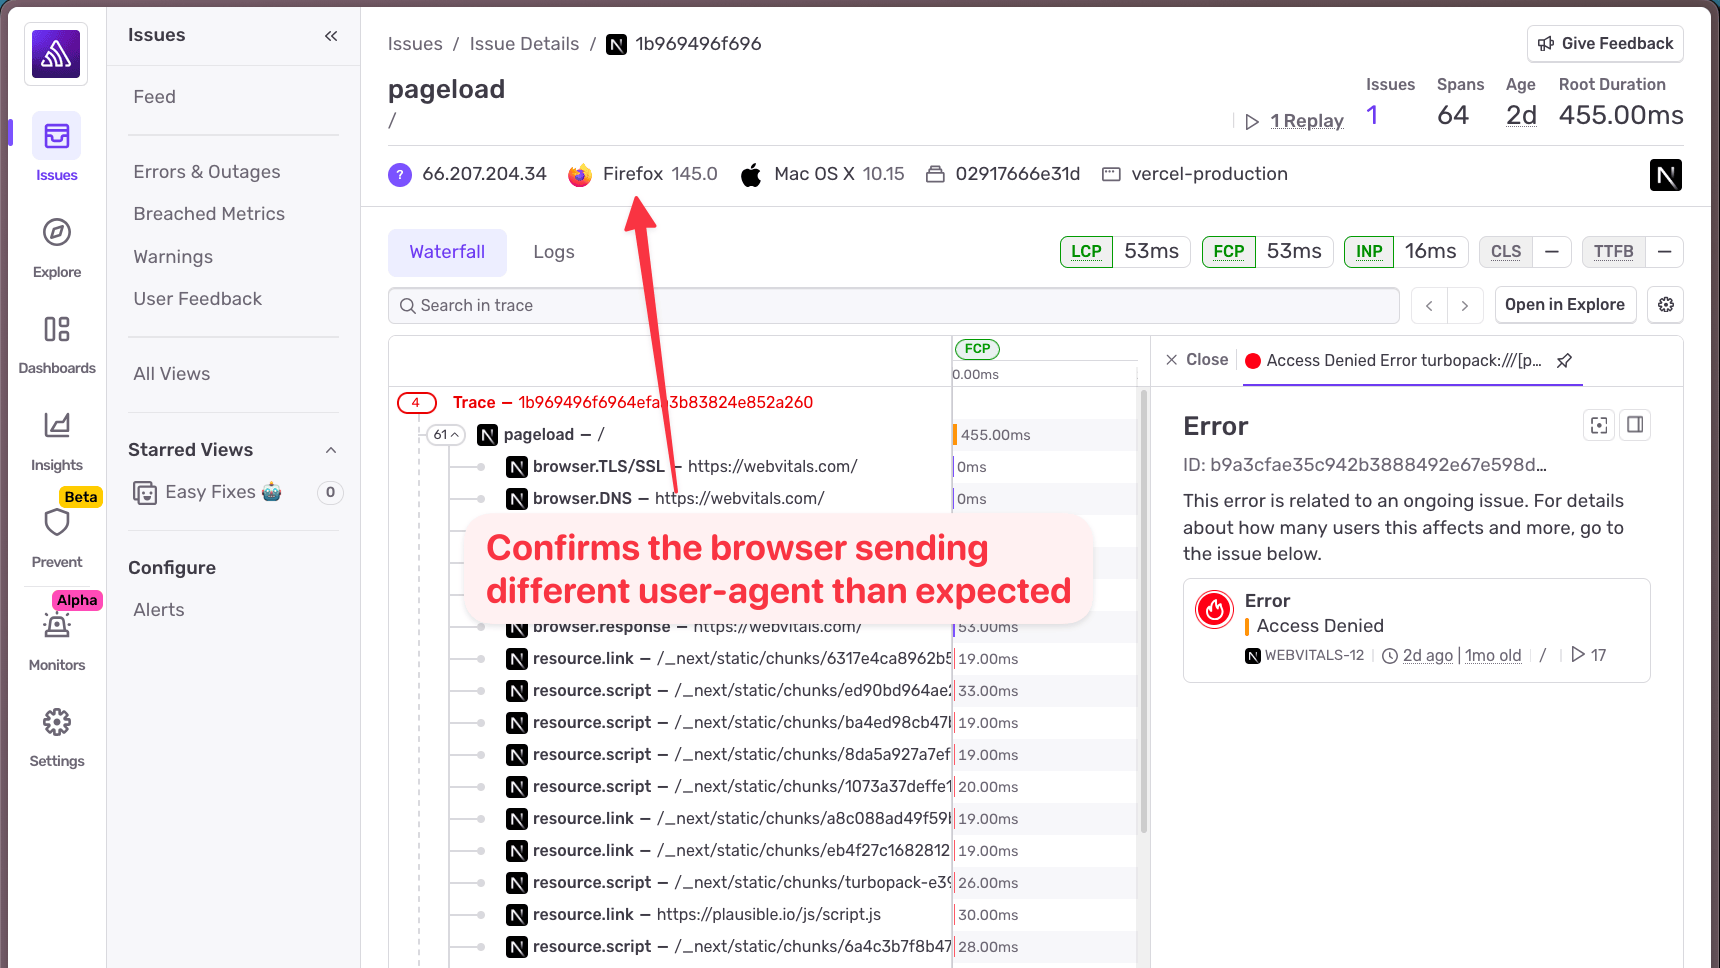
Sure enough, the trace confirmed this was coming from Firefox. Mystery solved.
Fixing the issue once the data told the story
The solution was straightforward. In Vercel's firewall settings, I added a rule to bypass bot protection for requests where the user agent contains ai-sdk.
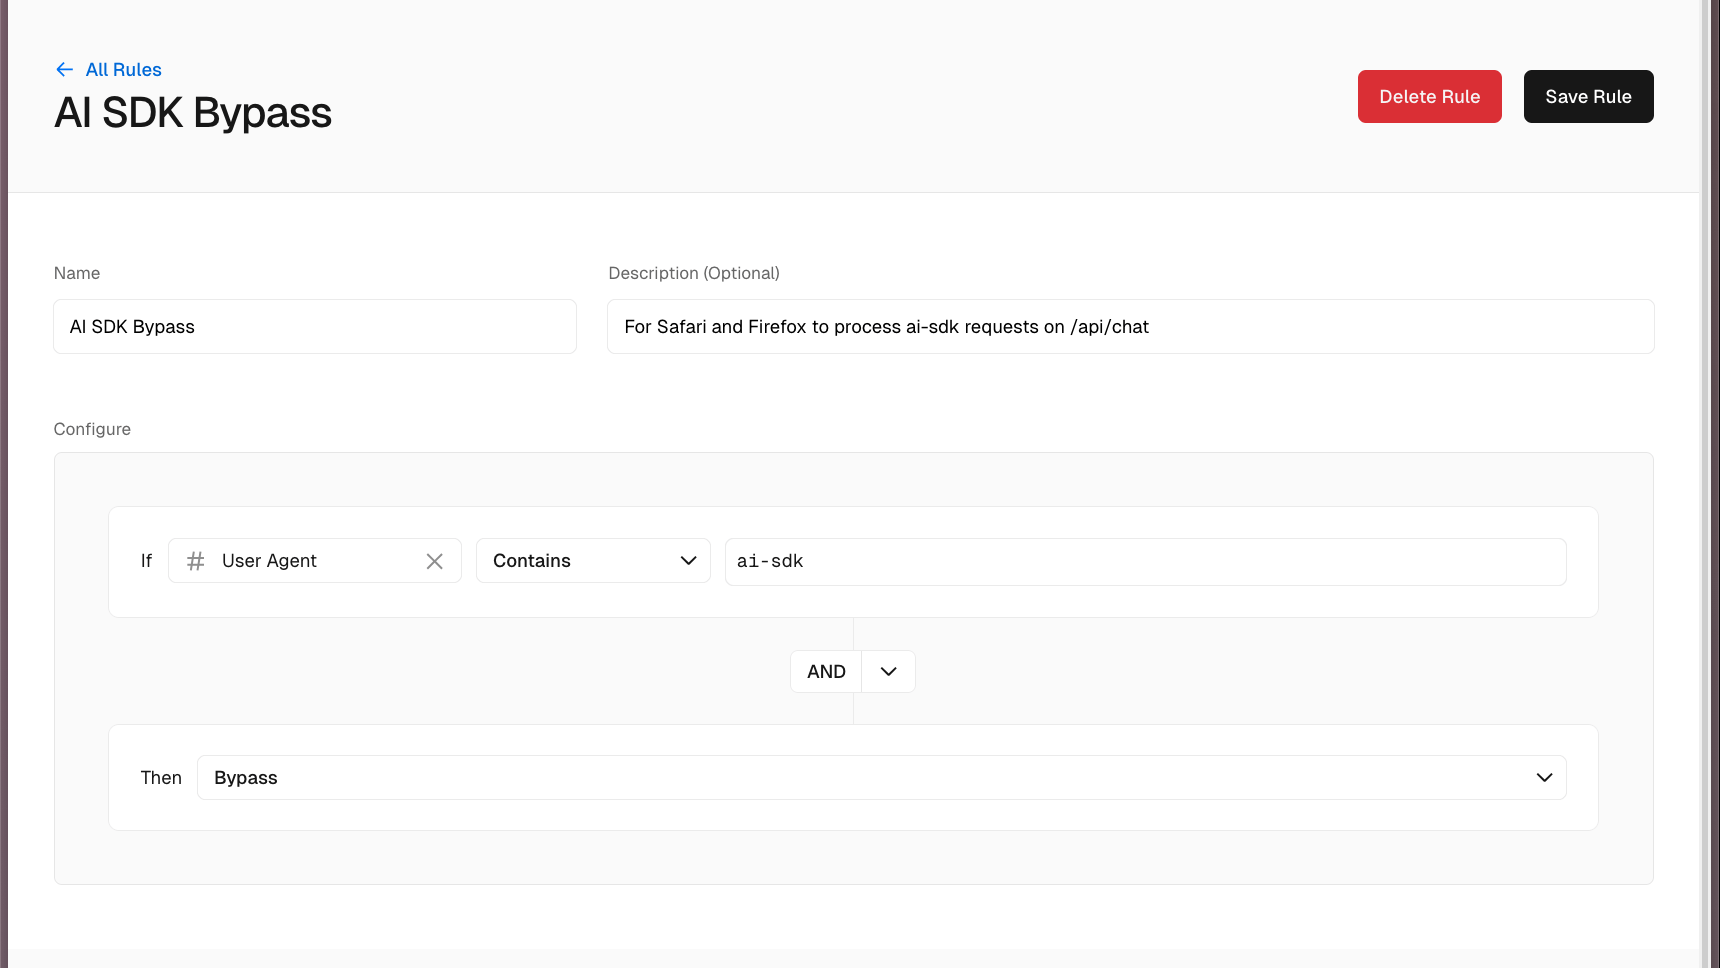
Saved the rule, published the changes, and tried again in Firefox.
It worked. No more access denied errors. It’s also being tracked in a Github issue on the AI SDK for those who are curious.
What this bug clarified about logging and debugging
This bug would have taken much longer to diagnose without logs. The error itself, "Access denied", told me nothing about why the request was being denied. The stack trace showed me where it happened, but not the data that caused it.
A few takeaways:
Logs provide context that stack traces can't. When you're debugging, you often need to know what the data looked like at a specific point in time. Errors capture the moment of failure; logs capture the journey.
High-cardinality attributes are powerful. Being able to search logs by any attribute:
isBot,userAgent, makes it trivial to slice and dice your data. You don't have to predict which attributes will be useful ahead of time.Trace connection ties everything together. Seeing a log in isolation is useful, but being able to jump from a log to the full trace (and vice versa) gives you the complete picture. In this case, it let me confirm that the AI SDK user agent was indeed coming from Firefox requests.
If you're already using Sentry for error tracking, adding logs is a natural next step. For new projects, you can use the Sentry.logger API directly. If you have existing logging with something like Pino, check out the logging integrations to pipe those logs into Sentry automatically.
Head on over to our Next.js Logs docs to learn more about how to send structured logs from your application to Sentry for debugging and observability. Or just check out our Logs quickstart guide and get up and running in no time.
Not everything that breaks throws an error. Sometimes you just need to see what was happening.