From random chunks to real code — wiring up Next.js source maps in Sentry
From random chunks to real code — wiring up Next.js source maps in Sentry


When you ship a Next.js app, the React and TypeScript you write aren’t what your users actually download. Next.js compiles, minifies, splits, and shuffles your code into chunks in ways that are great for performance and terrible for debugging.
This post shows you how that pipeline works, how source maps and debug IDs connect it all back to your original code, and how to wire things up so Sentry shows you real file names and line numbers instead of an unreadable stack trace.
What actually happens to your code
In a typical Next.js app, your React + TypeScript source goes through a build pipeline that compiles it to JavaScript, HTML, and CSS, minifies that output, and splits it into chunks so users only download what they need.
All of this is good for page load. It's less good for you when an error happens and your stack trace now points into static/chunks/12345-something.js instead of app/page.tsx.
Your code goes from something you recognize to something you really do not. That's where source maps step in. Each of those compiled bundle chunks gets two important pieces of metadata — a debug ID and a sourceMappingURL that points to the corresponding source map.
Sentry uses the debug ID on the uploaded minified file to find the matching debug ID on the uploaded source map. Once it has that pair, it can de-minify the stack trace, map it back to the original file, line, and column, and show you the code you actually wrote, not just the code your bundler generated.
Why dev tools show nice stack traces but Sentry shows chunks
In development, things look fine in the browser. You run the app in dev, you throw a sample error, and your browser devtools show a readable stack trace with your real filenames and source.
That's because when you run next dev, the browser’s got direct access to local source maps and your original source files. It can resolve everything on its own, without Sentry.
If you point that same dev build at Sentry, Sentry only sees what you send it. Without uploaded source maps, it just sees whatever bundles and chunk files the dev build produced. The result is a browser with a nice, human-readable stack trace and Sentry with a stack trace full of randomly named chunks.
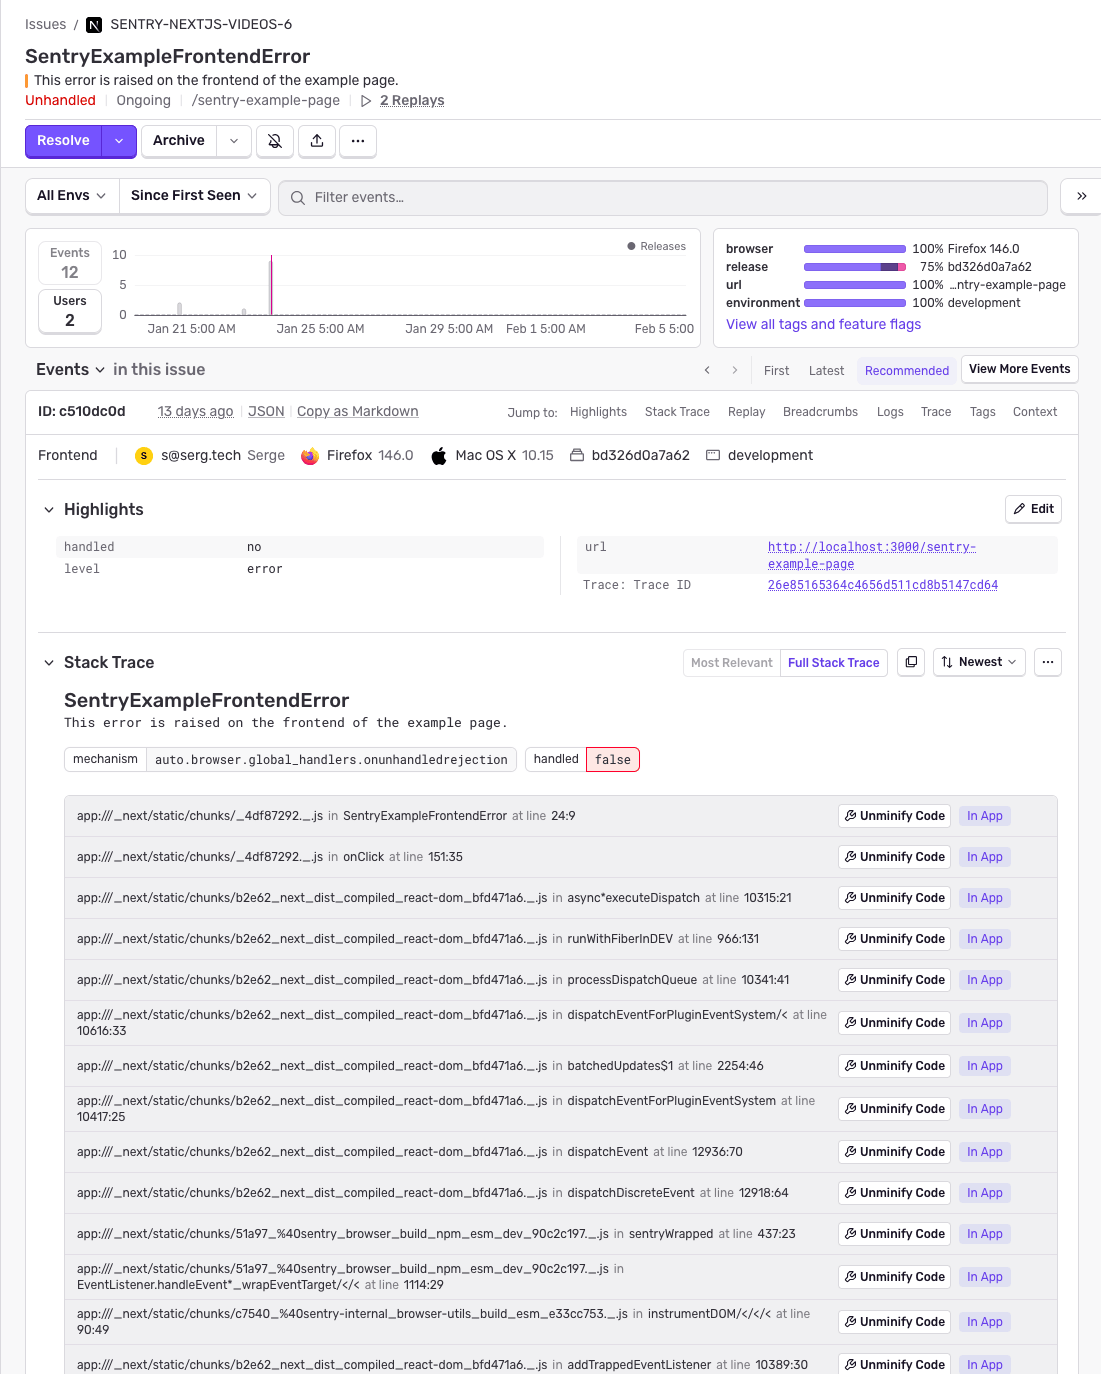
Those chunk names change across builds, which means you can easily end up with the same logical error appearing multiple times as different issues in Sentry.
Use Sentry for production, Spotlight for local debugging
If you're actively working on a feature and throwing errors on every refresh, you're going to generate fresh chunks, send lots of near-duplicate errors, and burn through Sentry quota on problems only you ever saw.
For that local dev loop, use a tool like Spotlight. It's built for local development, works similarly to Sentry, and keeps all that debug noise out of your Sentry org so you can save Sentry for production issues from actual users.
Simulating a production build so Sentry gets your source maps
Sentry cares about the production artifacts — the optimized bundles and matching source maps that your real users hit. To simulate a production environment locally and make sure Sentry sees what it needs, build your app and start it:
npm run build
npm run start
npm run build creates the optimized production build where Sentry hooks in, and npm run start serves that build as if it were running in production.
This run goes through the same pipeline as your deployed app, and it's during this process that Sentry hooks in to upload your bundles and source maps.
What Sentry does during the build step
During the production build (when you run npm run build), Sentry hooks into the "after production compile" step. In that phase, Sentry collects the generated chunks, finds their source maps, and uploads both to Sentry.
After uploading, Sentry deletes the source maps from the build output so they don't ship to the browser. That gives you readable stack traces in Sentry, without handing over your original source code to every user who opens devtools.
If you want to see the more general ways to upload source maps (beyond Next.js), check out the uploading source maps docs.
Verifying that source maps are wired up correctly
Once you've run npm run build and npm run start, trigger that same sample error again and compare. In the browser console, you should now see a long, minified stack trace. That's expected. The browser no longer has access to your source maps in this production-style setup.
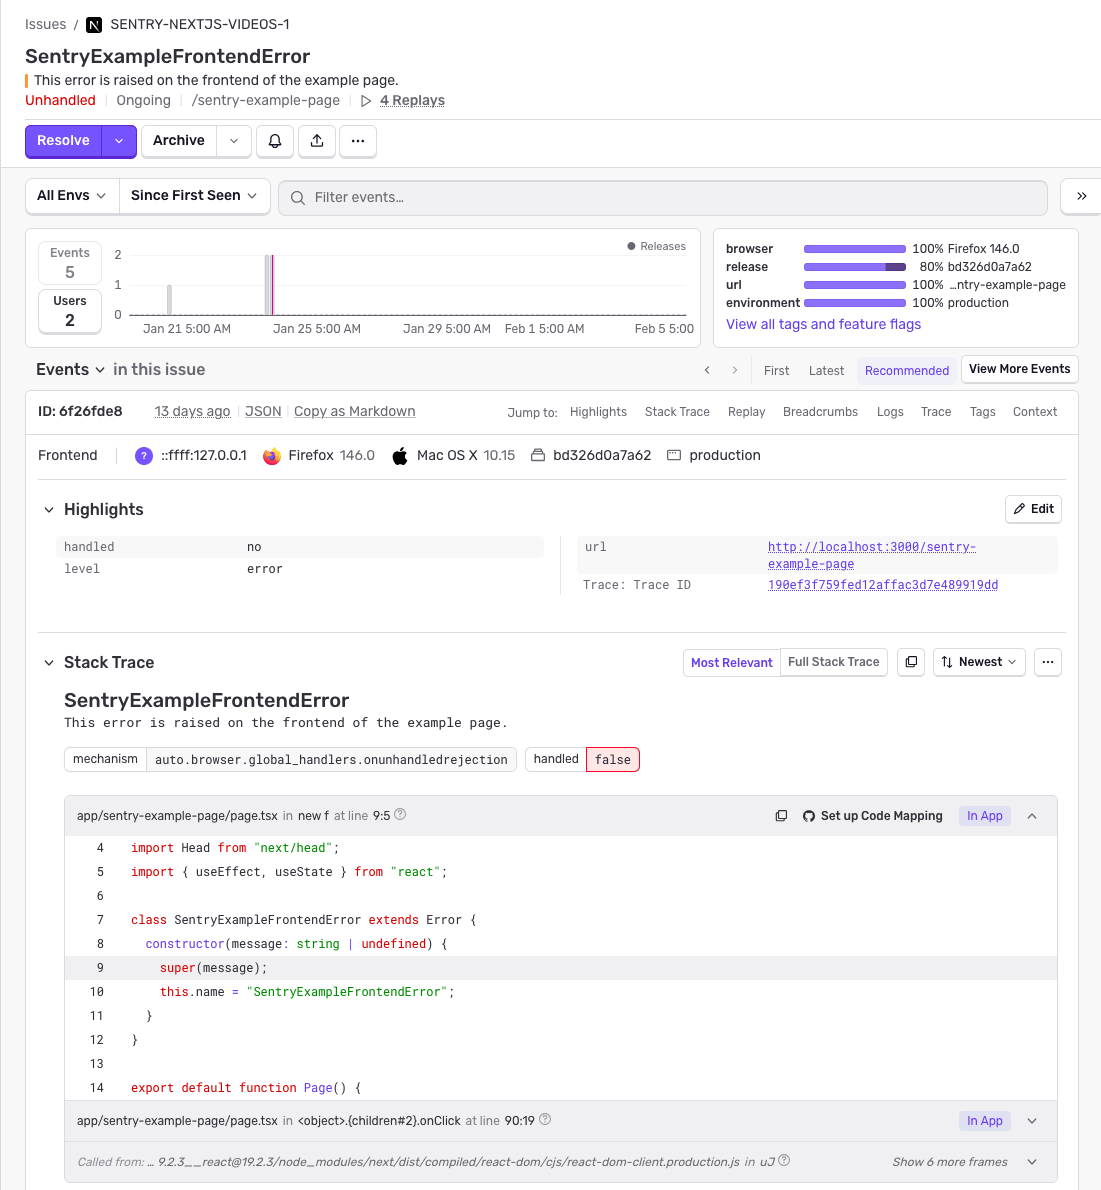
In Sentry, refresh the Issues page and open the new error. The stack trace should now point to your real Next.js files with the code you actually wrote. If the Sentry stack trace looks readable and matches your source, your source maps are wired up correctly.
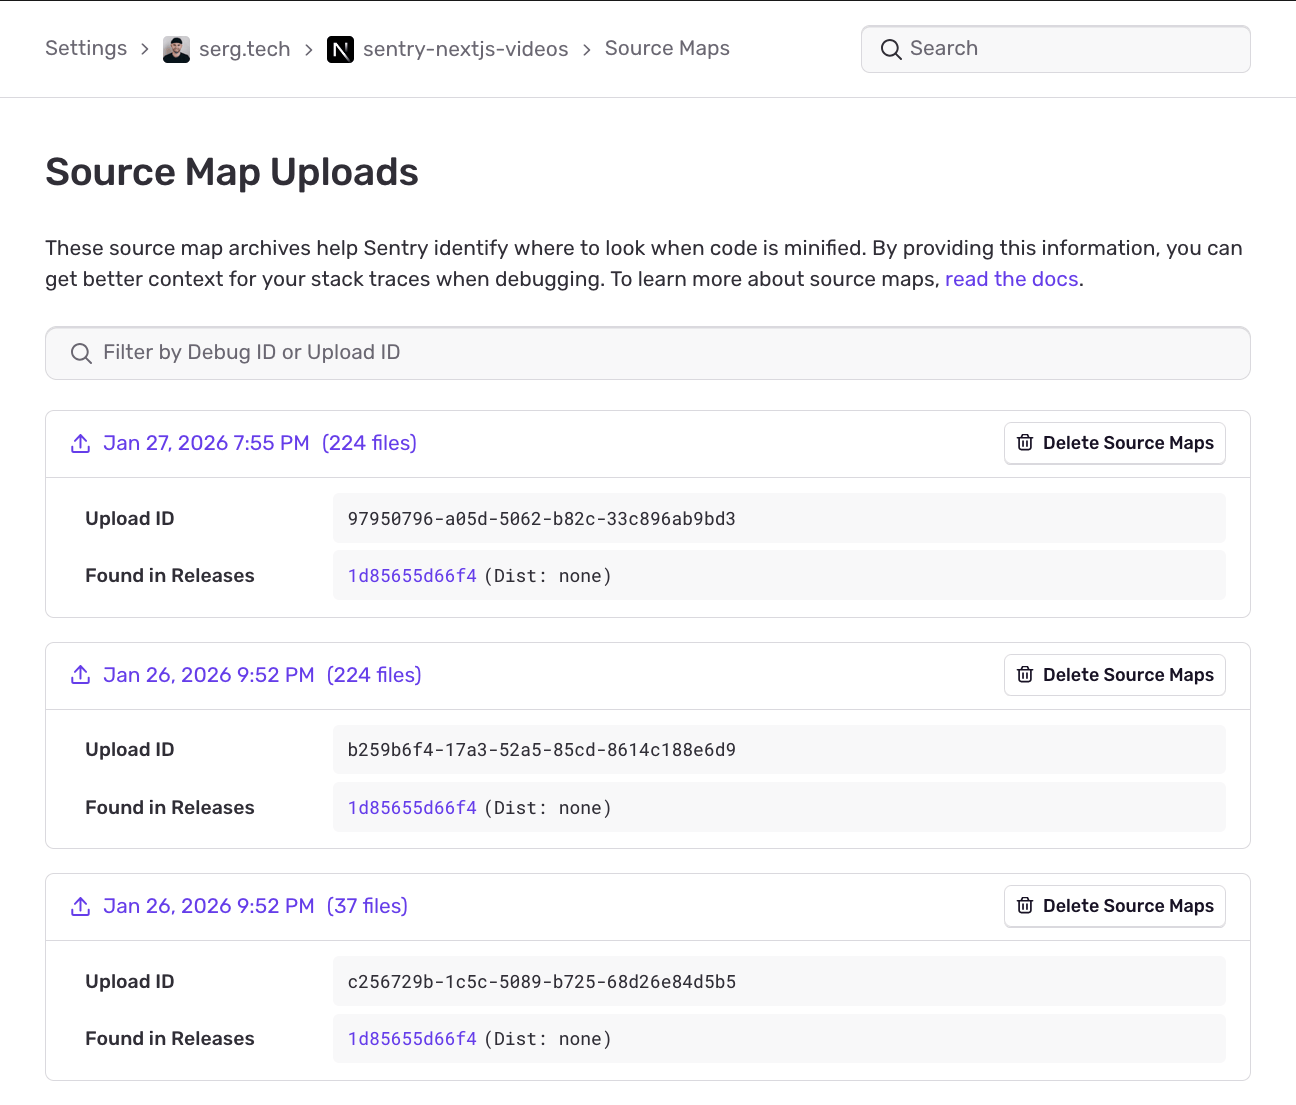
In Sentry, source maps live in your project settings. Go to Issues, use the project selector to pick your Next.js project, click Project Settings, and in the sidebar, open the Source Maps page.
You’ll see all source maps uploaded for that project. For a Next.js app, you might see a client bundle, a server bundle, and an edge bundle. Seeing multiple entries for the same release is normal. Next.js just builds different bundles for different runtimes.
If source maps aren't behaving the way you expect (for example, Sentry still shows chunked or minified frames), go to the Source Maps page for your project, delete the existing source maps, rerun your production build with npm run build, and start the app again with npm run start and trigger an error.
This triggers a clean upload and often fixes issues caused by stale or mismatched files.
Double-checking your Next.js and Sentry configuration
If you're building your app but no source maps are appearing in Sentry, it usually comes down to configuration.
In your Next.js + Sentry setup, double-check that your Sentry organization is set correctly, the Sentry project is the one you actually expect, and you're providing a valid auth token.
You can set the auth token either directly in your Sentry-related config or via the SENTRY_AUTH_TOKEN environment variable in whatever environment is running your builds (local, CI, Vercel, etc.).
As long as the environment variable is in place, you don't need to hardcode it in your config.
Where to go when you're still stuck
If you've rebuilt the app in production mode, cleaned up and reuploaded source maps, and double-checked your Sentry config and environment variables, and your stack traces still look wrong, check the docs for Next.js source maps and the troubleshooting section under that page.
Those walk through common misconfigurations, show known-good examples, and give you a checklist to compare against your own setup.
And if you still have questions after that, let us know. We're happy to help you get from random chunk names back to the code you actually wrote. Find us on Discord, or if you're new to Sentry, you can explore our interactive Sentry sandbox or sign up for free.